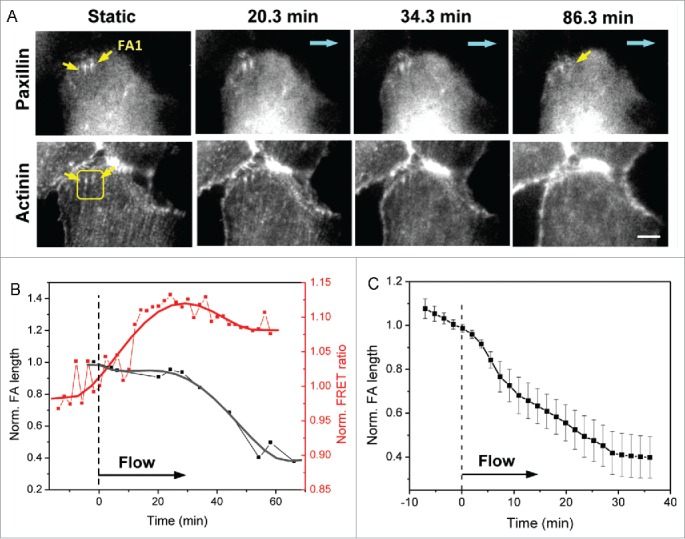
Figure 3.

Dynamics of FAs linked with radial stress fibers under flow. (A) Images of paxillin-mApple and actinin-sstFRET (YFP channel) in a ROI near cell edge, showing FAs with actin normal to the cell edge (indicated by yellow arrows) decreasing in size under shear stress (upper panel) as the associated actin stress fibers disintegrate (lower panel). Blue arrows indicate the flow direction. (B) Time dependence of length of FA1 (indicated by yellow arrow in (A) and regional FRET ratio (yellow box in A), showing that FA disassembly is associated with stress release. (C) Averaged length variation of multiple FAs linked to radial stress fibers (n = 14, p = 0.00004, paired sample t-test before and after 36 min of shear). Error bars indicate s.e.m. Scale bar = 5 μm.
