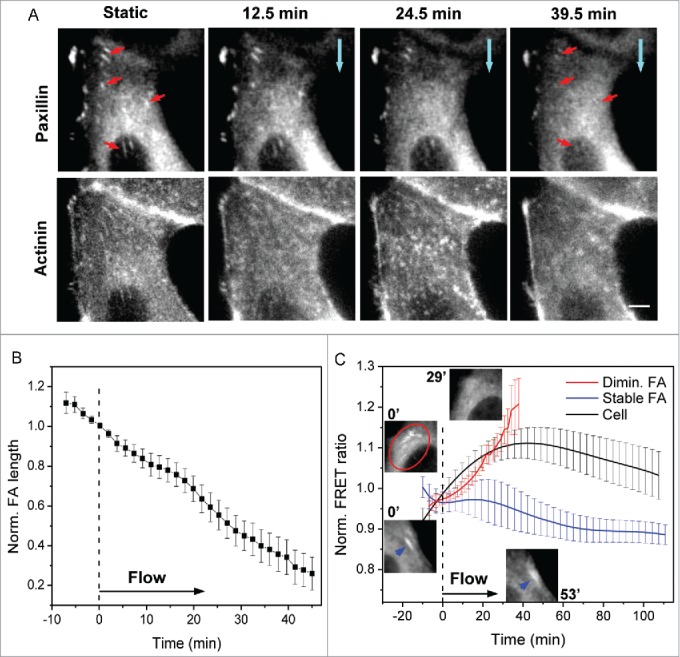
Figure 6.

Dynamic changes of interior focal adhesions under flow. (A) Images of paxillin-mApple and actinin-sstFRET (YFP channel) of interior region of a cell in static condition and at various times during application of flow (blue arrows show the direction of flow). Multiple FAs in the interior region (indicated by red arrows) shown under static condition diminish after ~40 min of shear stress (upper panel). This is associated with disassembly of linked actin stress fibers (lower panel). (B) Averaged length variation of multiple FAs in the interior region (n = 22, p = 1 × 10⁻⁷, paired sample t-test for FA lengths before and after 31 min of shear). (C) Time course of FRET ratio for diminishing FAs (red curve, n = 17, p = 0.0005, paired sample t-test for stress before and after 18 min of shear) and stable FAs along the cell periphery (blue curve, n = 6, p = 0.14, paired sample t-test for stress before and after 110 min of shear), showing a stress release in diminishing FAs. The two top insets show interior FAs before and after 29 min of shear stress; bottom two insets show a peripheral FA (indicated by blue arrows) persisting under flow. The black curve shows time variation of average FRET ratio for entire cell (n = 7) for comparison. The error bars indicate s.e.m. Scale bar = 5 μm.
