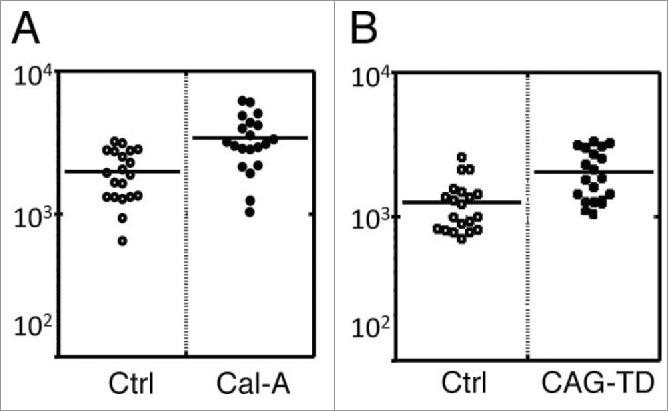
Figure 5.

AFM analysis of Moesin transfectants. (A) AFM analysis of Cal-A-treated HEK293T cells. Average Young's modulus of Cal-A treated and non-treated control (Ctrl) cells were 3397 and 1979 Pa, respectively. (B) AFM analysis of Moesin-TD transfectants. Average Young's modulus of GFP+ transfectants and GFP- cells were 2033 and 1251 Pa, respectively. The lower Young's modulus of GFP- cells compared to control cells in A is due to the effect of lipofection.
