Figure 2.
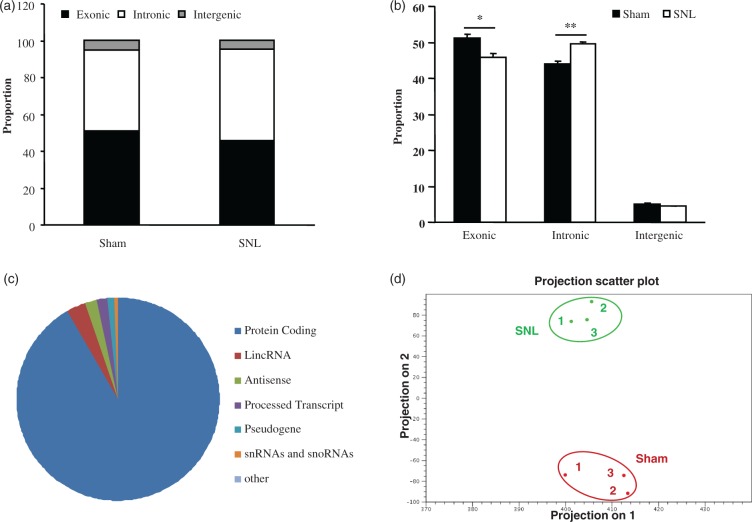
Transcriptome profiling in mice fourth lumbar dorsal root ganglia after nerve injury. (a) The mapped proportions of exonic, intronic, and intergenic reads in sham and SNL group. (b) There is a significantly lower proportion of reads that align to exonic regions in SNL samples when compared with sham samples, and the proportion of reads that align to intronic regions is significantly higher in SNL samples compared with sham samples. (c) The distribution of differentially expressed RNAs in the fourth lumbar dorsal root ganglia associated with peripheral nerve injury. (d) PCA was performed using the log2-transformed and quantile-normalized RPKM values. The colors indicate different groups of samples. The results represent the mean ± SEM of three independent experiments. *p < 0.05; **p < 0.01 compared with the sham group.
PCA: Principle component analysis; RPKM: reads per kilobase per million; SNL: spinal nerve ligation.

