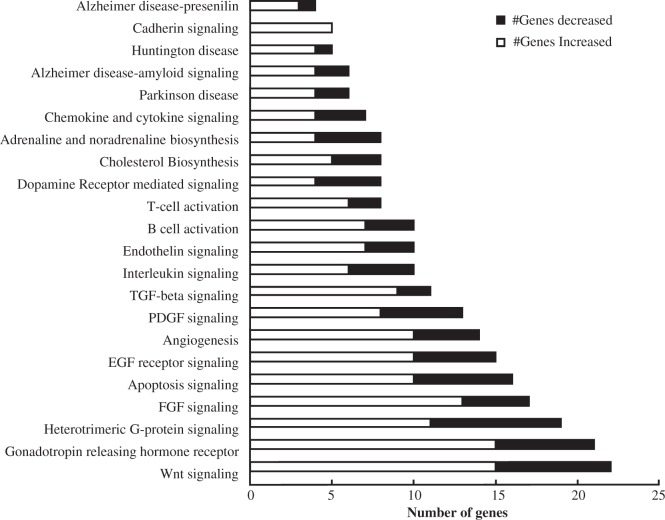
Figure 6.
Pathway analyses of the most significant and differentially expressed genes after nerve injury. PANTHER GO analyses groups the most significantly increased (white bars) and decreased (black bars) gene transcripts based on their annotated roles in biological pathways. A total of 237 genes are represented in this pathway analyses, all with greater than a twofold change after nerve injury and a FDR. p < 0.05. FDR: false discovery rate.

