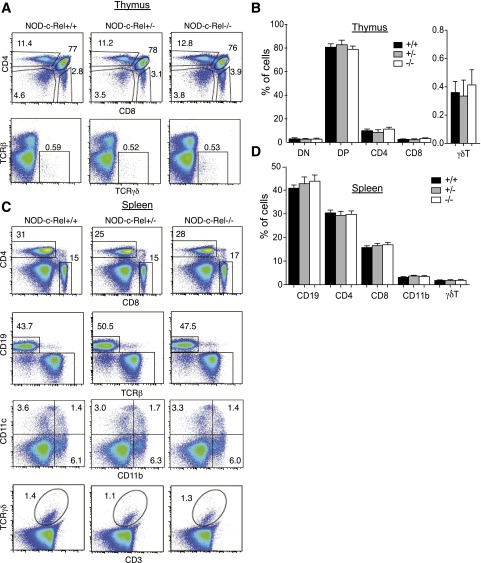
Figure 2.
Major hematopoietic cell populations in NOD mice are not affected by c-Rel deficiency. Flow cytometric analysis of hematopoietic populations in thymus (A and B) and spleen (C and D) comparing NOD c-Rel+/+, heterozygous NOD c-Rel+/−, and homozygous NOD c-Rel−/− mice. A: Representative plots of CD4 vs. CD8 and TCRβ vs. TCRγδ from three independent experiments for thymocytes. B. Histogram summary of three experiments with percentages (mean ± SEM) for double-negative (DN), double-positive (DP), CD4, and CD8 single-positive subsets as well as γδT cells, showing normal distributions of thymocytes in all three mouse genotypes. C: Representative plots of CD4 vs. CD8, CD19 vs. TCRβ, CD11c vs. CD11b (gated on CD19− cells), and TCRγδ vs. CD3, for splenocytes. D: Histogram summary of three experiments with percentages (mean ± SEM) for CD19+ B cells, CD4+, CD8+, and γδT cells as well as CD11b+ myeloid cells, showing normal distributions of cells in all three mouse genotypes. FACS plots are representative of three experiments, and bar graphs represent the average of three mice per genotype.

