Figure 3.
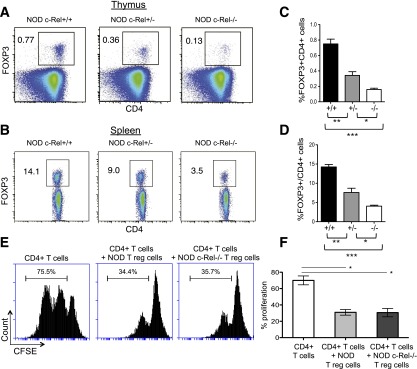
A and B: FOXP3 cells are differentially affected by the loss of one or two copies of c-Rel on the NOD background. Representative plots of surface CD4 vs. intracellular FOXP3 for thymocytes (A) and splenocytes (B). C and D: Histogram summary of four experiments showing the percentage of FOXP3+ CD4+ cells (mean ± SEM) in thymus (C) and the percentage of FOXP3+ cells among CD4+ cells in spleen (D) for each genotype. Results from t tests comparing each pair of genotypes for four mice from each group are as shown. E and F: c-Rel–deficient Treg cells are functionally competent in suppressing CD4+ T-cell proliferation in vitro. E: Flow cytometric analysis of carboxyfluorescein succinimidyl ester (CFSE) dilution in CD4+ T cells alone, with NOD Treg cells, and with NOD c-Rel−/− Treg cells. Histograms are representative of three mice per genotype from three experiments (F). Percentage of proliferating CD4+ T cells based on CFSE assay data. Bar graphs represent mean of duplicates from three mice per group. *P < 0.05, **P < 0.005, ***P < 0.0001.

