Figure 5.
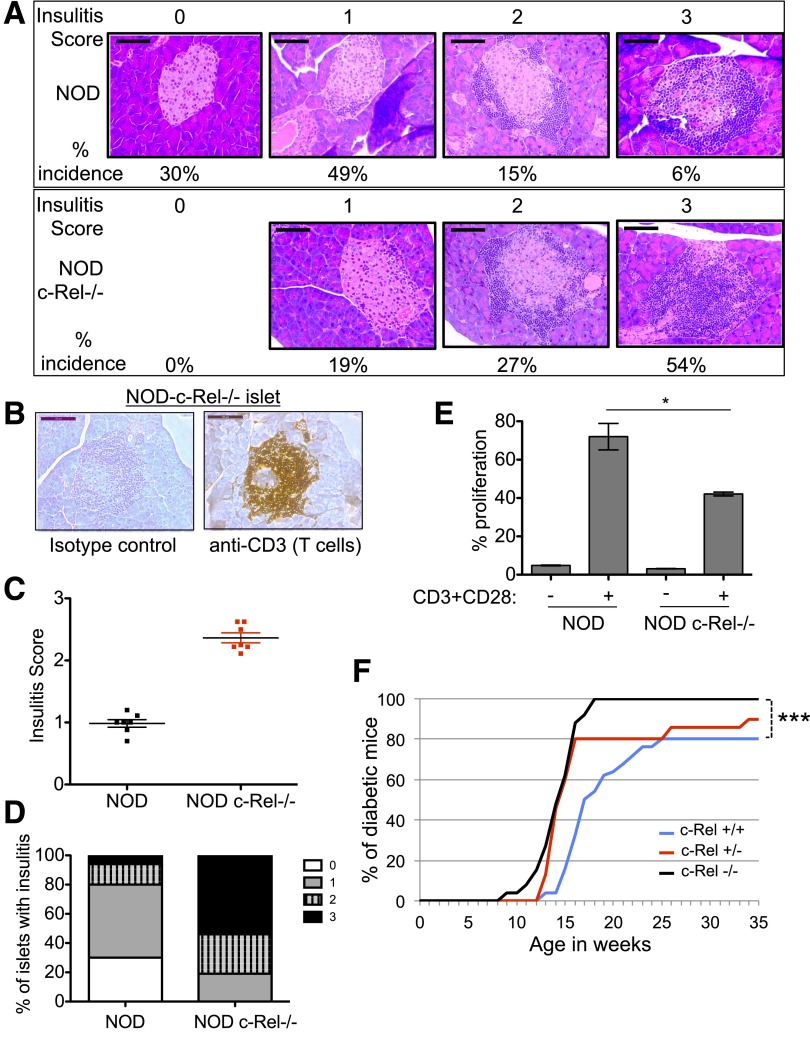
c-Rel deficiency accelerates insulitis and diabetes in NOD mice. A: Pancreata were isolated from 8–9-week-old prediabetic female NOD c-Rel+/+ (top) and c-Rel−/− (bottom) mice and analyzed by hematoxylin and eosin staining for insulitis. The histology shows islets representing insulitis scores of 0–3 and their percentage of incidence from NOD and NOD c-Rel−/− mice from >10 animals analyzed per group. B: T-cell infiltrates in the islets. Pancreas sections of NOD c-Rel−/− mice were stained using an anti-CD3 or isotype control antibodies. Scale bar = 100 μm. Data represent staining performed on pancreatic tissue sections from four mice for each genotype. C and D: Insulitis score and the percentage of islets with each grade of insulitis in NOD and c-Rel−/− NOD mice. C: Insulitis was scored from seven mice per genotype, and the mean score of individual mice was plotted. Scale: no infiltration = 0; peri-islet infiltration of <25% of islet = 1; invasive infiltration of 25–50% of the islet = 2; high infiltration of >50% of the islet = 3. The insulitis score was analyzed using ANOVA; P < 0.0001 (Prism). D: Percentage of islets with each grade of insulitis calculated from 63 c-Rel+/+ and 59 c-Rel−/− islets from 36 independent sections for each mouse, with a total of seven mice per group. E: TCR-induced proliferation of CD4+ T cells isolated from spleen of NOD and c-Rel−/− NOD mice. Data are mean of triplicates from two mice per genotype. *P < 0.05. F: c-Rel+/+ (n = 26), c-Rel+/− (n = 16), and c-Rel−/− (n = 27) NOD mice were analyzed weekly for blood glucose levels. Once the glucose level reached 250 mg/dL, the mice were monitored twice a week. Mice showing three consecutive readings of 250 mg/dL were marked as diabetic. Significant differences by log-rank test were seen between c-Rel+/+ and c-Rel−/− mice (***P < 0.001) and c-Rel+/+ and c-Rel+/− mice (*P < 0.05).

