
Figure 3.
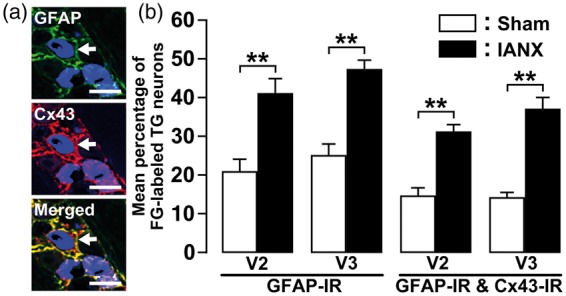
Cx43 and GFAP expression in TG of V2 and V3 following IANX. (a) Photomicrographs of Cx43-IR/GFAP-IR cells in TG of V3 on day 8 following IANX operation. Arrows denote double-IR cells. Scale bars: 50 µm. (b) Mean percentage of FG-labeled TG neurons encircled with GFAP-IR or Cx43-IR/GFAP-IR cells in TG of V2 and V3 on day 8 after IANX or sham operation. **p < 0.01 (n = 4 in each group; one-way analysis of ANOVA followed by Tukey’s multiple-comparison tests.)