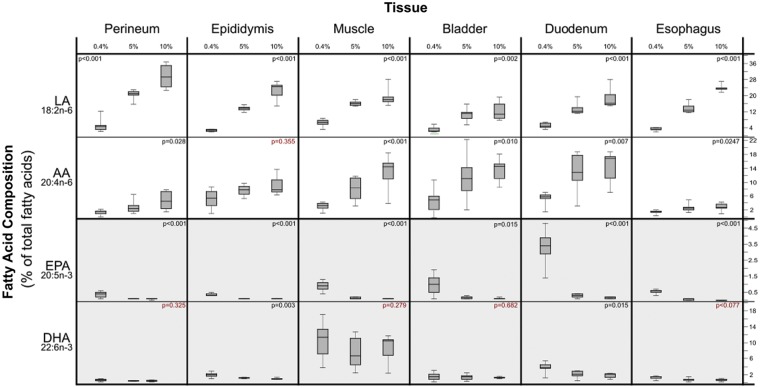
Figure 2.
Dietary LA-induced changes in the fatty acid content of peripheral tissues associated with idiopathic pain syndromes. Note that the Y-axis scales differ in these graphs. X-axis % values refer to percentage of food energy. Box plots include medians and interquartile ranges with end whiskers set to minimum and maximum values. Number of samples for each tissue (perineum n = 21, epididymis n = 21, skeletal muscle n = 24, bladder n = 21, duodenum n = 21, and esophagus n = 20). LA: linoleic acid; AA: arachidonic acid; EPA: eicosapentaenoic acid; DHA: docosahexaenoic acid.

