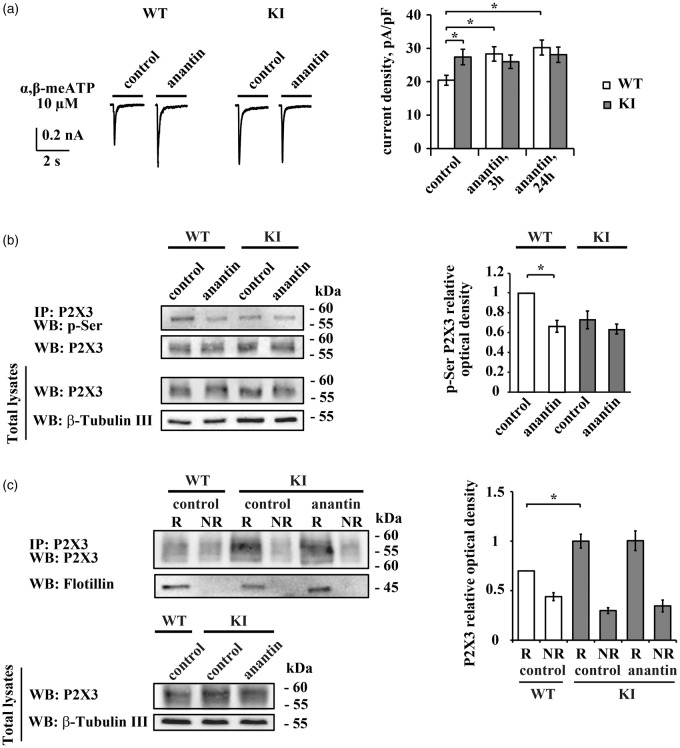
Figure 1.
Anantin effects on WT or KI trigeminal neurons. (a) Representative traces obtained with α,β-meATP (10 µM, 2 s) application show P2X3 current amplitudes in control and after 3 h anantin treatment (500 nM) in WT and KI trigeminal neurons. Histograms show average P2X3 current density values from WT or KI neurons in control or after 3 h or 24 h pretreatment with anantin (n = 25, 25, and 26 for WT; 42, 40, 34 for KI cells, respectively; *p < 0.05, Mann–Whitney rank sum test). Note that P2X3 currents in KI control are already potentiated compared to WT and cannot be further enhanced by anantin application. (b) Western immunoblotting shows the amount of P2X3 pSer and total amount of P2X3 receptors in control and after 24 h anantin (500 nM) application for WT and KI trigeminal cultures. β-tubulin was used as loading control. Histograms on the right show statistically lower P2X3 pSer (relative optical density value) in WT cultures after anantin application. In KI samples, pSer level is already low and is not altered by anantin (n = 4; *p < 0.05, Mann–Whitney rank sum test). (c) Top panel is a representative example of Western immunoblotting showing the amount of P2X3 receptors in raft (R) and non-raft (NR) membrane fractions in control or after treatment with anantin (500 nM, 24 h). Flotillin bands indicate lipid raft membrane fractions. Lower panel shows total amount of P2X3 receptors for each experimental condition; β-tubulin was used as loading control. Histograms on the right quantify mean P2X3 relative optical density values in lipid raft and non-raft membrane fractions (n = 4; *p < 0.05, Kruskal–Wallis test).

