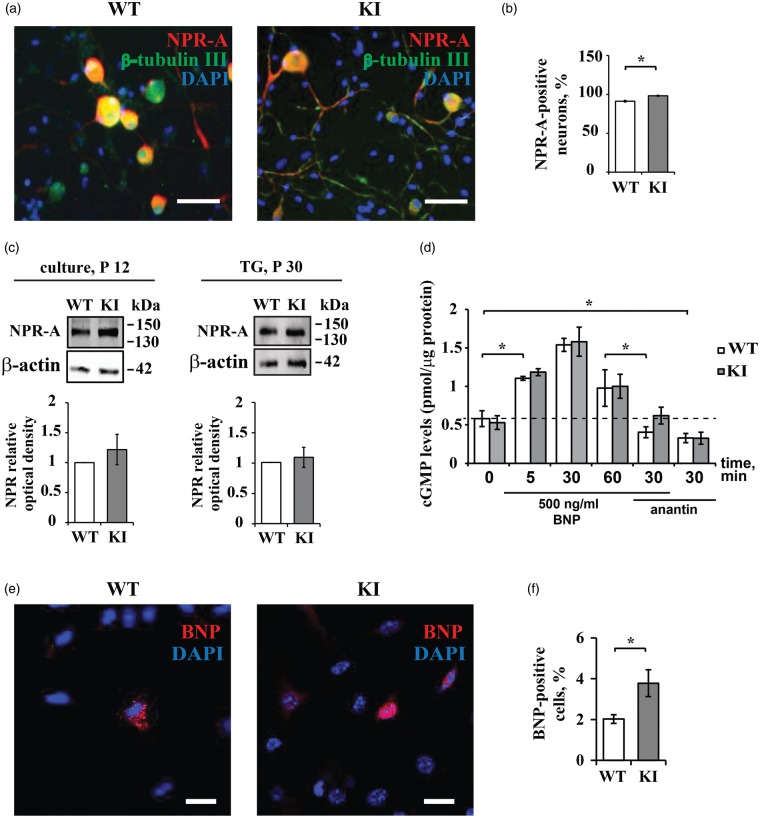
Figure 2.
BNP and NPR-A in WT and KI TGs. (a) Representative immunocytochemical examples of endogenous NPR-A expression in WT (left panel) and KI (right panel) mouse TG cultures. Nuclei are visualized with DAPI (blue); scale bar = 50 µm. Note extensive costaining of NPR-A (red) and β-tubulin (green). (b) The histograms quantify percentage of NPR-A positive cells in WT and KI cultures (n = 4; *p < 0.05, Kruskal–Wallis test). (c) Western blot showing protein expression of NPR-A in TG from P30 mice (right) and TG cultures from P12 mice (left). β-Actin was used as a loading control. Histograms (bottom) quantify NPR-A relative optical density values for each examined group. (d) ELISA-based quantification of intracellular cGMP in TG cultures from WT and KI mice. Cultures were treated with BNP (500 ng/ml for 5, 30, or 60 min) and/or anantin (500 nM, 30 min) or vehicle (indicated as 0). Note similar dynamics of cGMP increase after BNP application and similar decrease after treatment with anantin alone (500 nM) throughout. Data were normalized to the total protein content in each sample and are presented as mean value ± standard deviation (n = 3 in which samples were run in duplicate; *p < 0.05, Kruskal–Wallis test). (e) Immunocytochemical analysis of BNP (red) in WT and KI mouse TG culture. Nuclei are visualized with DAPI (blue). Scale bar, 15 µm. (f) Histograms show percent value of BNP-positive cells in WT and KI populations (DAPI-labeled cells).

