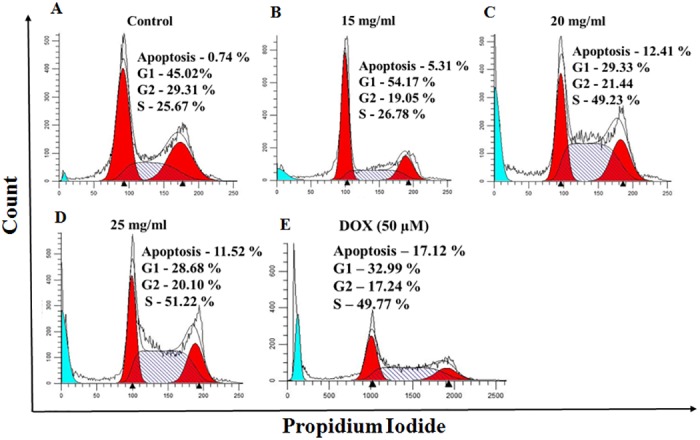
Fig 3. Cell cycle arrest in MCF7 cells.

Representative cell cycle images of MCF7 cells after 24 h of treatment with MEAD at 15, 20 and 25 mg/ml MEAD. The histogram indicates 'S' phase arrest and decrease in cell numbers in 'G1' phase of cell cycle in a dose dependent manner. The sub-G1 phase which is indicative of apoptosis also showed increase in a dose dependent manner.
