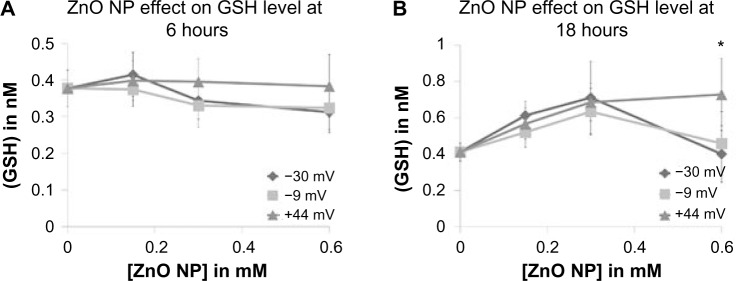
Figure 10.
Intracellular concentration of total GSH, in response to exposure to differently charged (−30, −9, and +44 mV) ZnO NPs.
Notes: Total GSH levels were measured at (A) 6 and (B) 18 hours after treatment with various ZnO NP concentrations. Whole-cell lysates from 1×10⁶ Jurkat cells were assayed for GSH using a commercial kinetic assay. Data were analyzed using repeated measures ANOVA, and statistical significance is denoted with an asterisk (P<0.05), n=3.
Abbreviations: GSH, glutathione; NP, nanoparticle; ANOVA, analysis of variance.

