Figure 2.
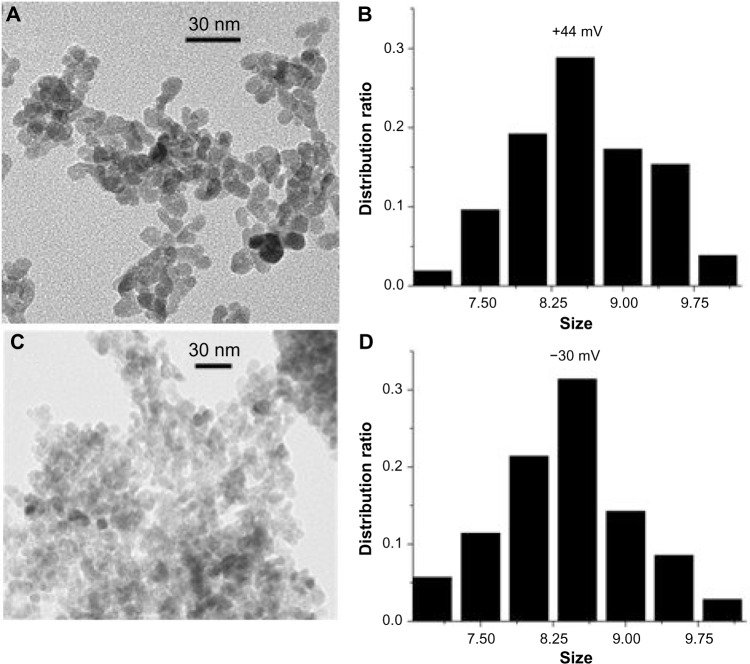
TEM characterization of ZnO nanoparticles.
Note: TEM images of selected samples with the (A) most positive (44.2 mV) and (C) most negative (−30.9 mV) surface charge; the corresponding size distribution plots are shown in (B) and (D), respectively.
Abbreviation: TEM, transmission electron microscopy.

