
Figure 2.
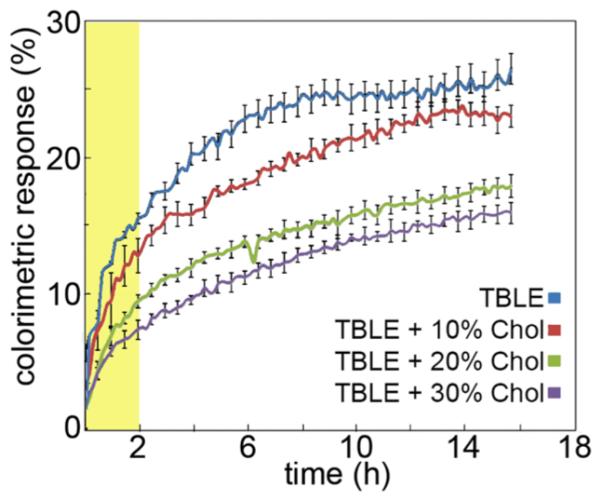
Percent colorimetric response (%CR) of TBLE/PDA vesicles containing various amounts of cholesterol upon exposure to htt-exon1(51Q) plotted as a function of time. Error bars indicate one standard deviation (n = 3). The highlighted area indicates the time frame accessible with AFM experiments described later.