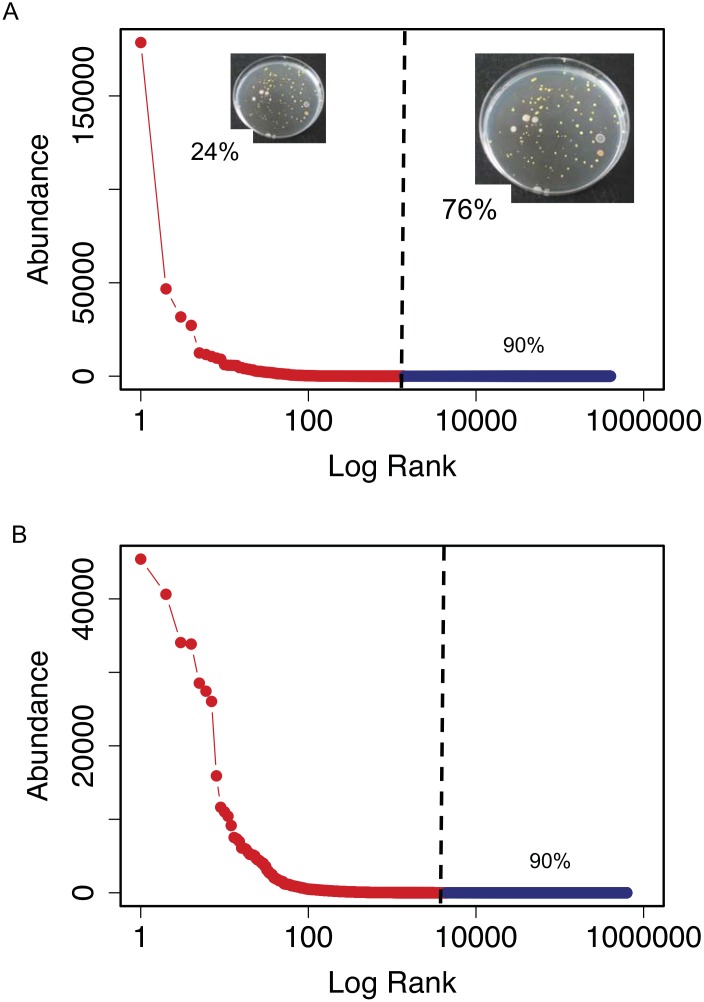
Fig 2. Rank-abundance plots of surface (A) and bottom (B) samples.
The red line is the rank-abundance plot calculated with the actual data. The dark blue line shows the estimates of the sequencing effort necessary to retrieve 90% of the total richness calculated by simulation from the best-approximating Sichel distribution (posterior mean estimate). The vertical black line separates the real data (left) from the estimates (right). In (A) the percentage of cultured isolates found in the 454-pyrosequencing dataset is indicated at the left side of the black vertical line. The percentage of cultured isolates not found in the 454-pyrosequencing dataset, and that would presumably be found by increasing the sequencing effort, is indicated at the right of the black vertical line. Insert pictures show some of the bacterial cultures grown from the surface sample. Font size and pictures are scaled according to the percentage of cultured isolates found or not found in the 454-pyrosequencing dataset.

