
Figure 7.
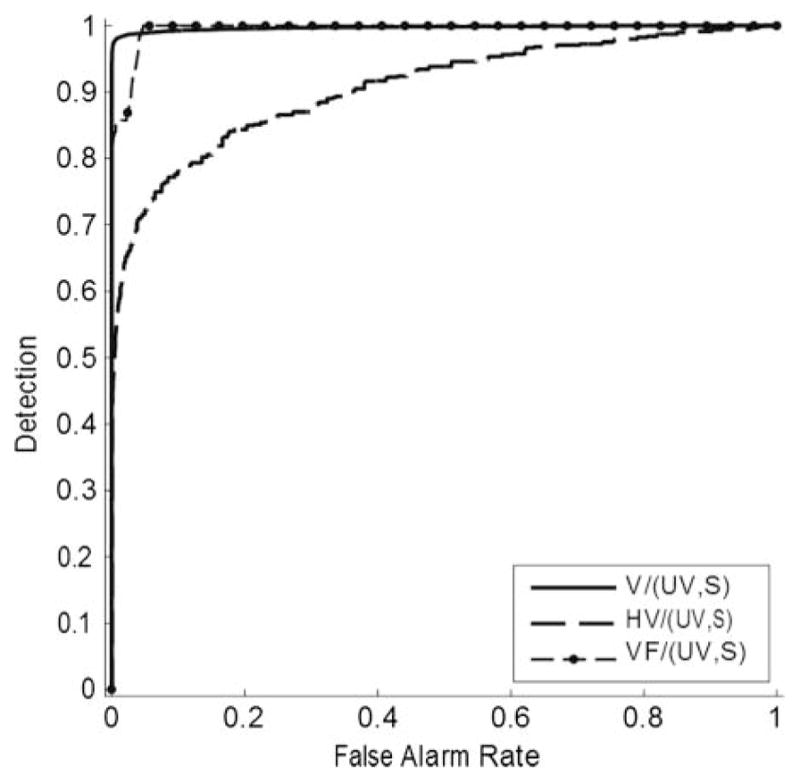
ROC curves giving the voicing-detection performance of the system. V, VF, and HV frames were separately considered to be positives. In each case, both UV and S frames were considered to be negatives. Area under the curve (Az) values were as follows: V/(UV,S) = .997; HV/(UV,S) = .907; VF/(UV,S) = .995.