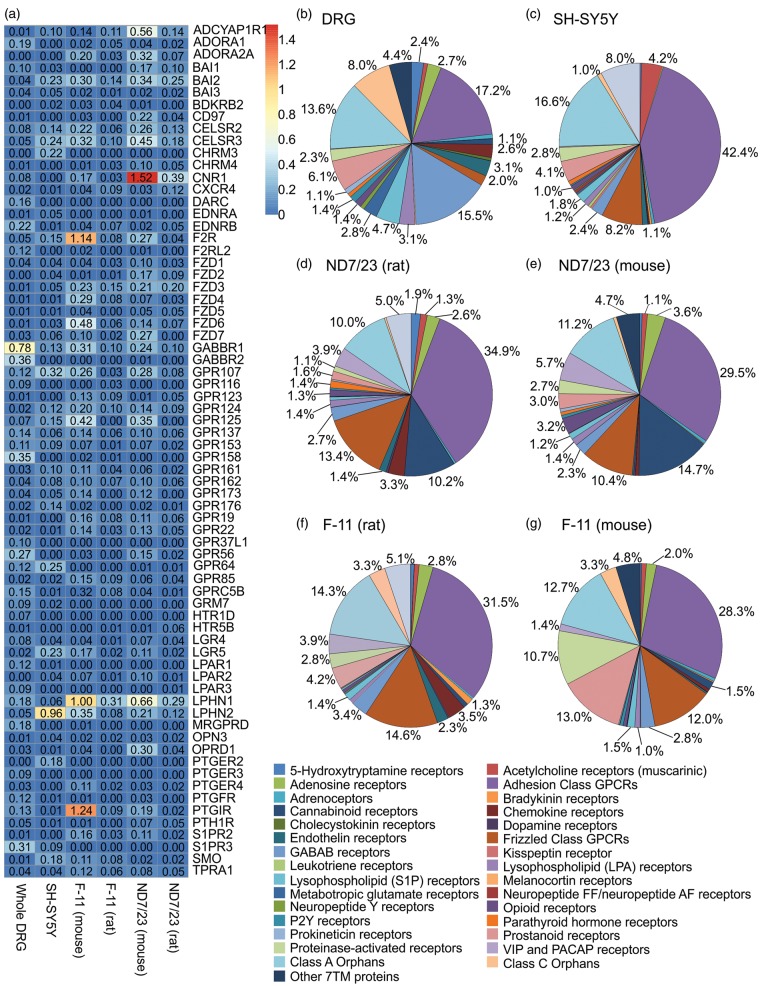
Figure 3.
Whole DRGs and cell lines have unique expression patterns of GPCRs. Sections of the pie chart without an annotated percentage constituted ≤0.5% of total ion channel expression in the sample. (a) Compilation of the GPCR genes with the highest expression levels for each sample. (b) Distribution of GPCR expression in whole DRGs. (c) Distribution of GPCR expression in SH-SY5Y cells. (d) Distribution of GPCR expression in ND7/23 cells (aligned to the rat genome). (e) Distribution of GPCR expression in ND7/23 cells (aligned to the mouse genome). (f) Distribution of GPCR expression in F-11 cells (aligned to the rat genome). (g) Distribution of GPCR expression in F-11 cells (aligned to the mouse genome).

