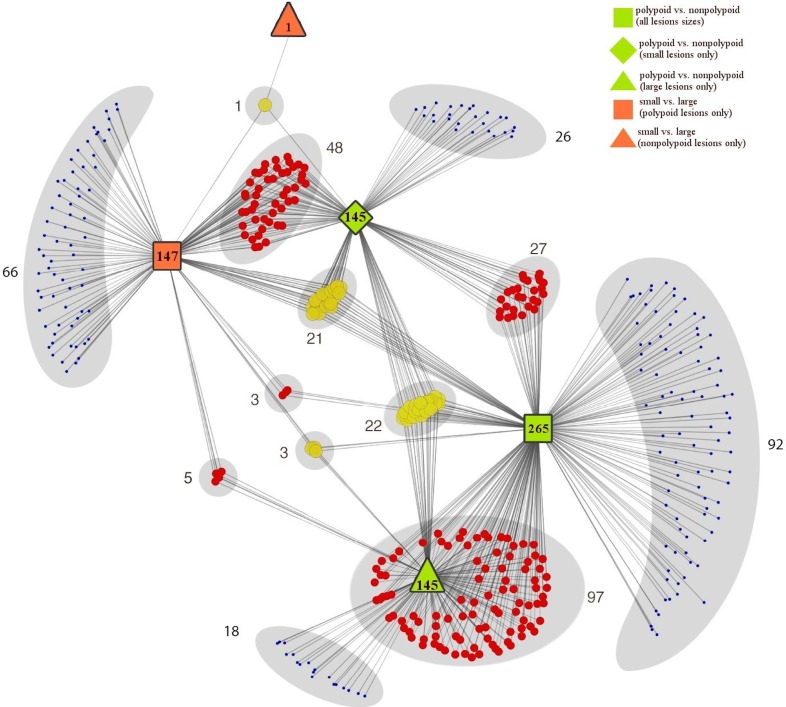
Fig 1. Distribution of immune pathways displaying significant dysregulation in GSEA analysis of the five group comparisons.
Colored circles represent 429 pathways that exhibited significant dysregulation (p-value < 0.05) in the GSEA analysis of one (blue), two (red), or three (yellow) of the five group comparisons: 1) polypoid vs. nonpolypoid (all lesions sizes, green squares); 2) polypoid vs. nonpolypoid (small lesions only, green diamonds); 3) polypoid vs. nonpolypoid (large lesions only, green triangles.); 4) small vs. large (polypoid lesions only, orange squares.); 5) small vs. large (nonpolypoid lesions only, orange triangle). The complete list of differentially regulated pathways with their p-values is reported in S1 Table.

