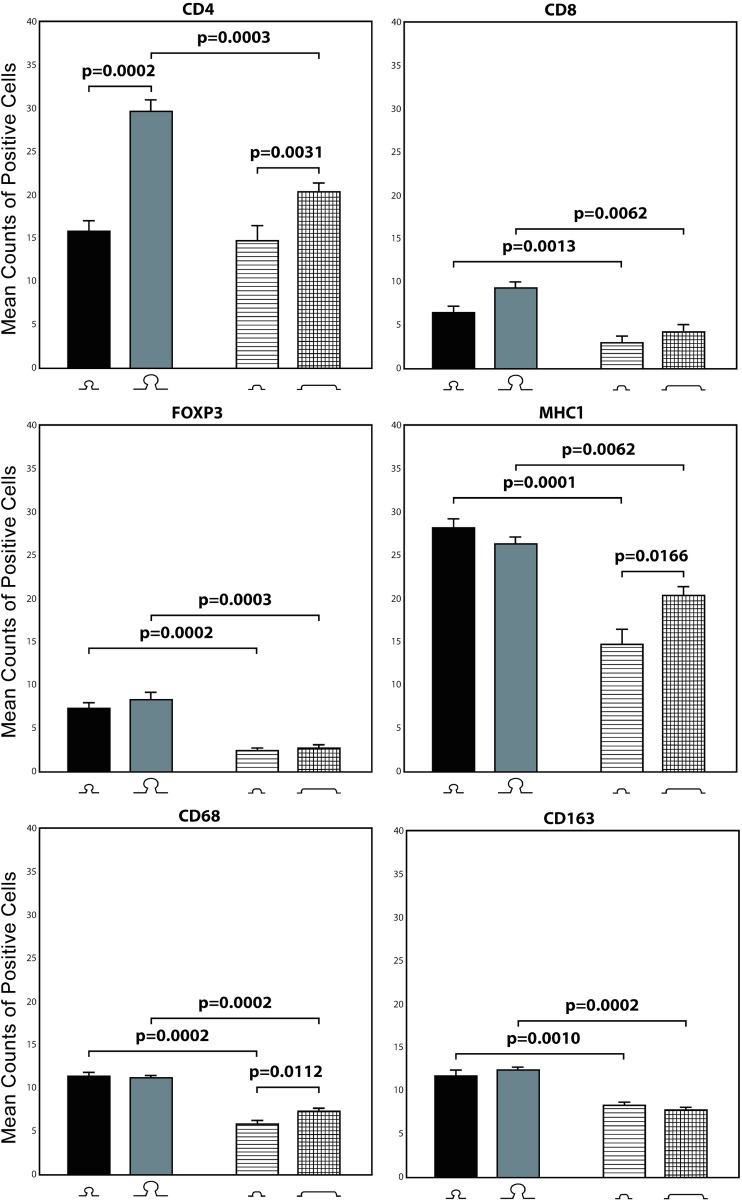
Fig 3. Immunohistochemical morphometric analysis of stromal immune cells.
Bars represent mean (SE) CD4+, CD8+, FOXP3+, MHC-I+, CD68+ and CD163+ cell counts for the following groups (from left to right): small polypoid lesions, large polypoid lesions, small nonpolypoid lesions, large nonpolypoid lesions. Horizontal bars with P values indicate significant differences between groups (Mann-Whitney test) (see Table 1for details).

