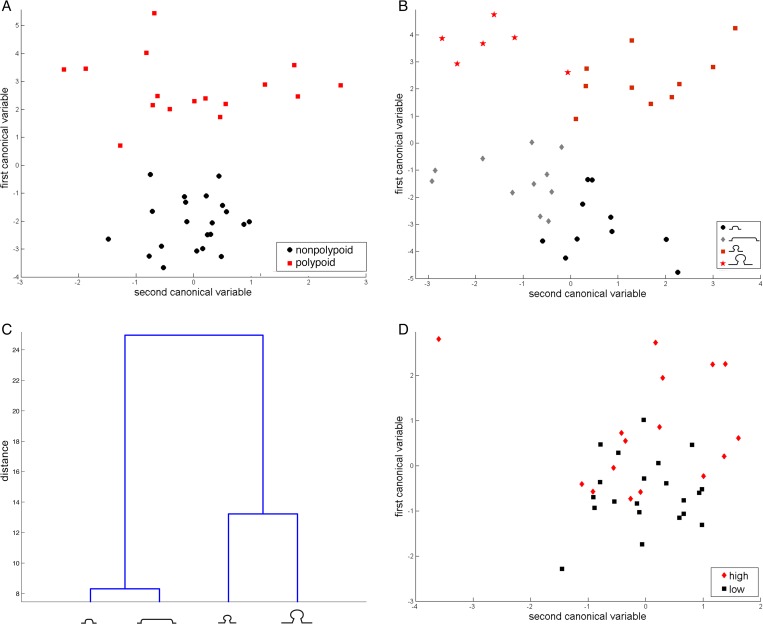
Fig 4. Multivariate analysis of polypoid and nonpolypoid lesions (small and/or large) using MANOVA test.
A) Scatter plot of the first two canonical variables for all polypoid (red squares) and all nonpolypoid lesions (black circles); B) scatter plot of the first two canonical variables for small polypoid lesions (red squares), large polypoid lesions (red stars), small nonpolypoid lesions (black circles), large nonpolypoid lesions (gray diamonds); C) dendogram plot of group mean clusters; D) scatter plot of the first two canonical variables for all adenomas with high-grade dysplasia (red diamonds) and all adenomas with low-grade dysplasia (black squares), regardless of morphology and size. In the scatter plots, each dot represents one tissue sample.

