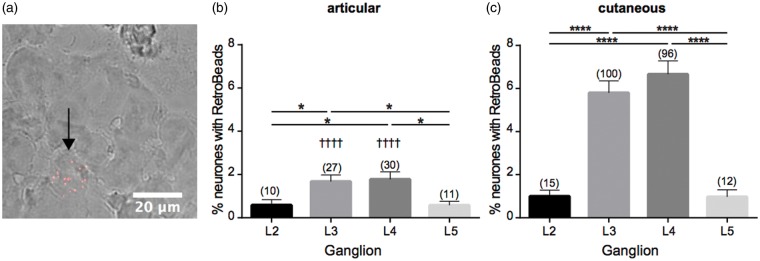
Figure 1.
Retrograde labeling of articular and cutaneous neurons. (a) DRG section, black arrow indicates neuron containing multiple RetroBeads. Quantification of percentage of neurons containing RetroBeads in L2–L5 DRG following injection of retrograde tracer to articular (b) or cutaneous (c) sites. Numbers in brackets refer to number of retrogradely labeled neurons counted per conditions. *p < 0.05 and ****p < 0.0001 between DRG in one set of animals; ††††p < 0.0001 between DRG of articular compared with cutaneous animals (one-way ANOVA and Tukey’s post hoc test). DRG: dorsal root ganglia; ANOVA: analysis of variance.

