Figure 3.
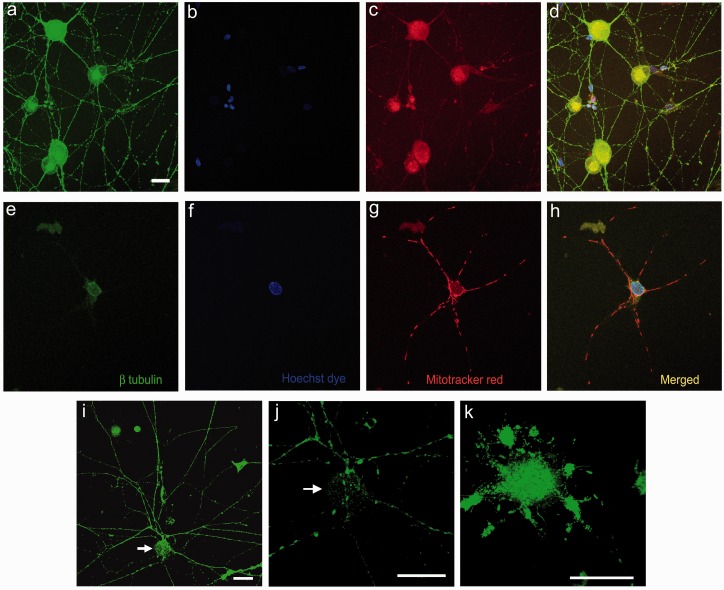
ML effect on rDRG neurons. Low power confocal images of control neurons (a–d) showing uniform distribution of β tubulin in the cell body and neurites (a), Hoechst dye stained nuclei (b), uniformly dispersed Mitotracker red labeled mitochondria (c) and the merged image with overlapping β tubulin and mitochondria (yellow, d). ML-treated neuron (100 nmol/L for 48 h) (e–h), showing loss of neurites and β tubulin (e), prominent nucleus (f), clumped Mitotracker Red positive mitochondria (g), and merged image (h). Live cell Mitotracker green labeling of mitochondria which are dispersed throughout the cell body (arrow) and neurites in a control neuron (i), and high power confocal images of the same neuron (j). In a ML-treated neuron, the Mitotracker label shows clumping of mitochondria restricted to the cell body, and loss of neurites (k). Bar in (a) =25 microns (a–h same magnification).

