
Fig. 4. Assay validation with controls.
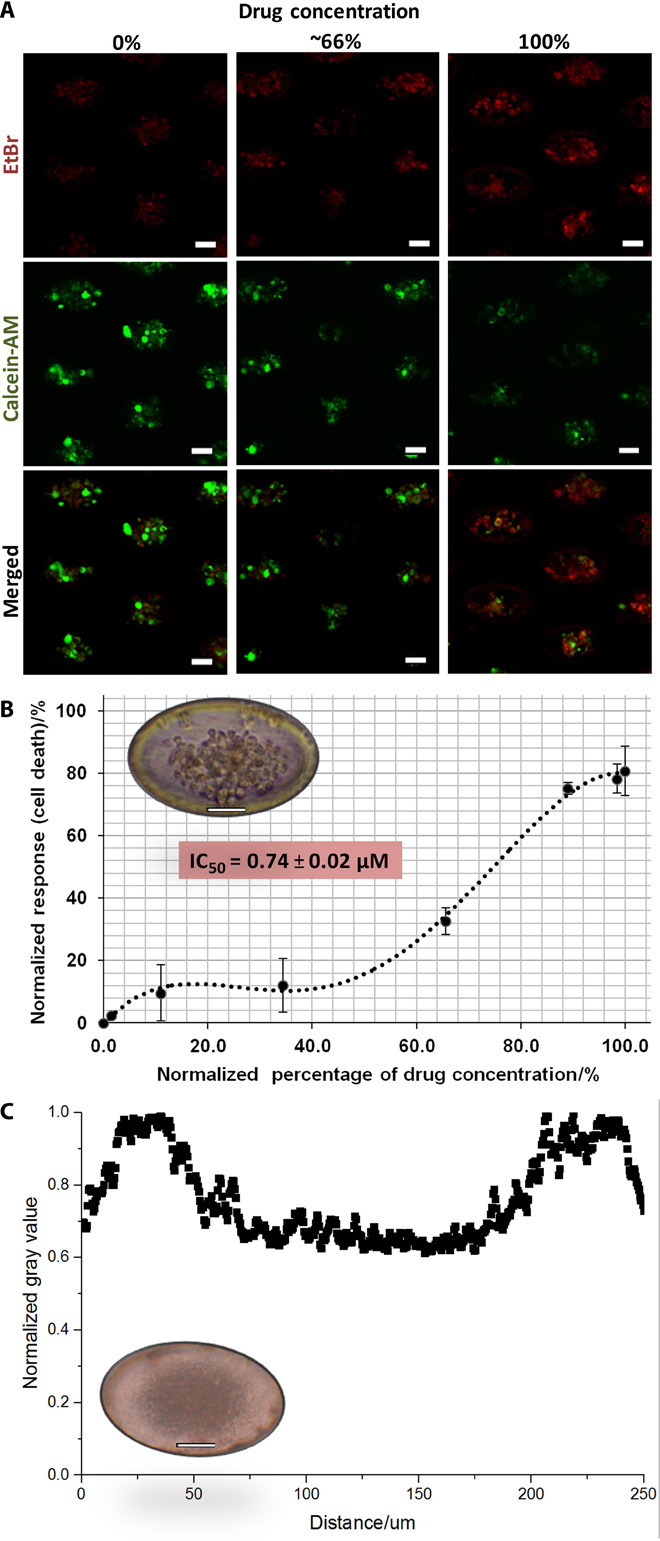
(A) Screening of doxorubicin in microwell assay using MCF-7 cancer cell line. Cultures were imaged in situ after staining with LIVE (calcein-AM; green) and DEAD [ethidium bromide (EtBr); red] under 72 hours of exposure to doxorubicin. Clusters under high drug concentrations are mostly nonviable (red), whereas clusters under low drug concentrations are mostly viable (green). (B) Dose-response curve and corresponding IC50 value (0.78 ± 0.02 μM) of MCF-7 generated from viability results. Representative image shows an MCF-7 cell cluster within a microwell (inset). Scale bars, 50 mm. (C) Scatterplot demonstrating overall high gray values that reflect the absence of clusters from cultures of blood from healthy volunteers. Representative image shows cell debris generated within a microwell from culture of a healthy sample (inset). Scale bars, 50 mm.