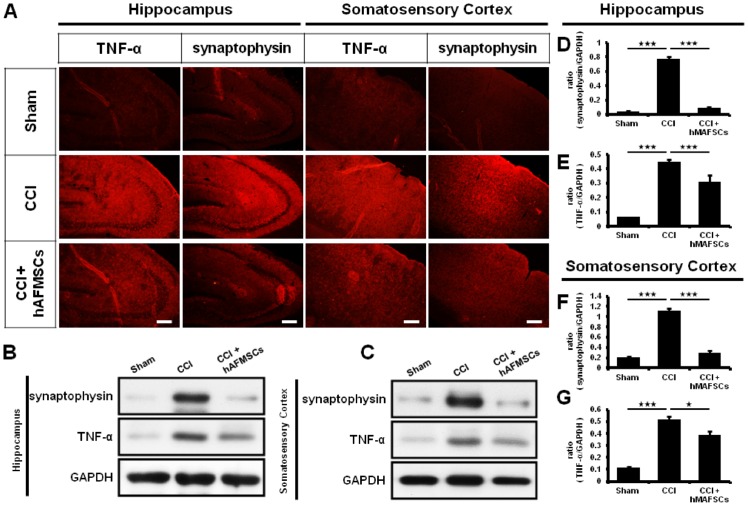
Fig 6. Expression of TNF-α and synaptophysin in hippocampus and somatosensory cortex after hAFMSCs treatment.
(A) Depiction of synaptophysin and TNF-α expression over the hippocampus (CA3) and somatosensory cortex in different treatment groups, (B) Representative of western blot analysis of synaptophysin and TNF-α over the hippocampus in the different treatment, (C) Representative of western blot analysis of synaptophysin and TNF-α over the somatosensory cortex in the different treatment, (D) Quantitative western blot analysis of synaptophysin over the hippocampus in different treatment, (E) Quantitative western blot analysis of TNF-α over the hippocampus in different treatment, (F) Quantitative western blot analysis of synaptophysin over the somatosensory cortex in different treatment, (E) Quantitative western blot analysis of TNF-α over the somatosensory cortex in different treatment. N = 6 for western blot analysis, Scar bar length = 100μm,*p < 0.05; **p < 0.01; ***p < 0.001.

