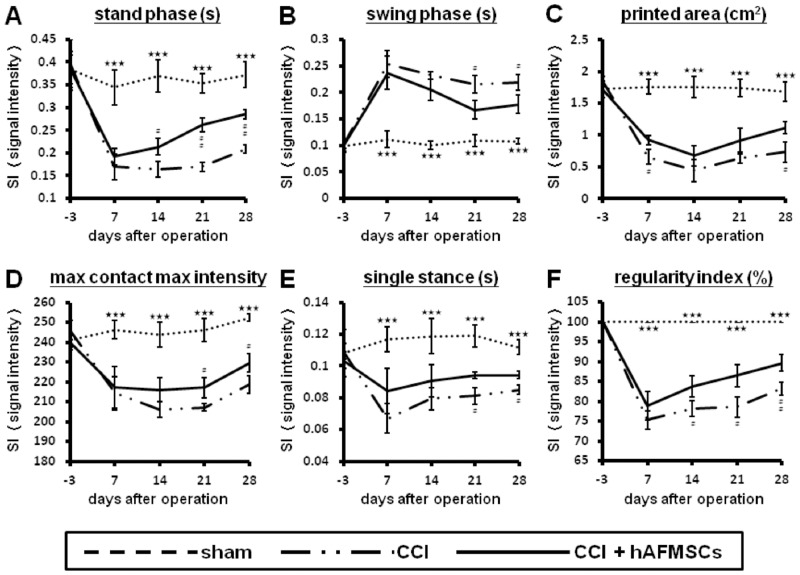
Fig 9. Illustration of various parameters of the CatWalk XT system related to various intensities of nerve damage at different time frames.
(A) Illustration of stand phase in different treatment related to different time frames, (B) Illustration of swing phase in different treatment related to different time frames, (C) Illustration of printed area in different treatment related to different time frames, (D) Illustration of maximum contact maximum intensity in different treatment related to different time frames, (E) Illustration of single stance in different treatment related to different time frames, (F) Illustration of regularity index in different treatment related to different time frames. Printed area, Maximum contact maximum intensity, Stand phase, Swing phase, Single stance, and Regular index: see text. *p < 0.05; **p < 0.01; ***p < 0.001 for sham vs. CCI group;#p < 0.05; ##p < 0.01; ###p<0.001 for CCI vs CCI+AFS group.

