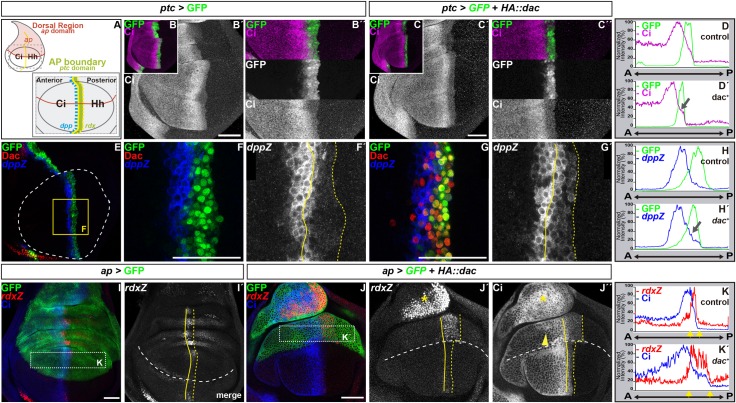
Fig 3. Expressing dac ectopically in the wing disc is sufficient to enhance Hh signaling.
(A) Schematics of the whole wing disc (upper) and of the distal wing disc (lower) showing the expression domain of ap and of Hh pathway components. ap and hh are expressed in the dorsal (red) and posterior domain, respectively. Hh signals to the anterior domain leading to CiFL accumulation and activation of rdx and ptc in the anterior-posterior (AP) compartment boundary (green) and of dpp (blue). (B-C´´,E-G´, I-J´´) Standard confocal sections of L3 wing imaginal discs with anterior to the left and dorsal up. (B-C´´,E-G´) ptc-Gal4 driving the expression of UAS-GFP (B-B´´,E-F´) or UAS-GFP (C-C´´,G-G´) and UAS-HA::dac. (I-J´´) ap-Gal4 driving the expression of (I-I´) UAS-GFP or (J-J´´) UAS-GFP and UAS-HA::dac. Discs are stained with (B-C´´) anti-Ci (magenta in B,C, upper panel in B´´ and C´´; white in B´,C´, bottom panel in B´´ and C´´) or (E-G´) anti-Dac (red in E,F,G) and anti-β-Galactosidase to reveal dppZ (blue in E,F,G and white in F´,G´) or (I-J´´) anti-Ci (blue in I,J and white in J´´) and anti-β-Galactosidase to reveal rdxZ (red in I-J and white in I´,J´). B´´ and C´´ are magnification of B and C, respectively. (D-D´) Profiles of the GFP (green lines) or Ci (magenta lines) intensity signals across the AP axis in B´´ and C´´, respectively. (H-H´) Profiles of the GFP (green lines) and dppZ (blue lines) intensity signals across the AP axis in F and G, respectively. The arrows in D´ and H´ highlight the accumulation of Ci and dppZ in the ptc>dac-expressing domain, respectively. (K-K´) Profiles of the Ci (blue lines) and rdxZ (red lines) intensity signals across the AP axis in the dorsal areal delimited by dashed line in I and J, respectively. Yellow arrows in K and K´ indicate the position of the AP compartment boundary. The plain and dashed yellow lines in F´,G´,I´ and J´-J´´ delimited the AP compartment boundaries. The white dashed line in E outlines the distal wing blade. F-F´ is a magnification of the yellow square in E. The white dashed line in I´,J´-J´´ indicate the dorsal-ventral boundaries. The yellow arrowhead in J´´ indicates the accumulation of Ci in the dorsal, anterior blade. The yellow asterisks in J´,J´´ indicate the upregulation of rdxZ (J´) and the accumulation of Ci (J´´) in the proximal dorsal domain. Scale bars represent 50μm.

