
Fig 3. Analysis of n-butyric acid induced BZLF1 gene expression in C666-1 NPC cells.
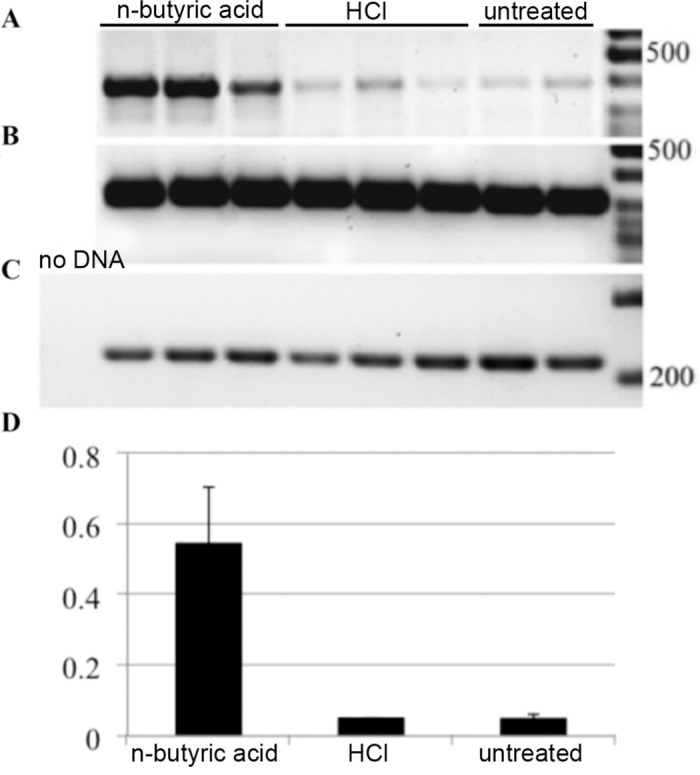
RT-PCR analysis upon treatment with 10mM of n-butyric acid or HCl. A. BZLF1 expression. B. GAPDH expression. C. BART A expression. D. Digital analysis of relative BZLF1 expression calibrated to GAPDH, calculated from data in panels A-C.