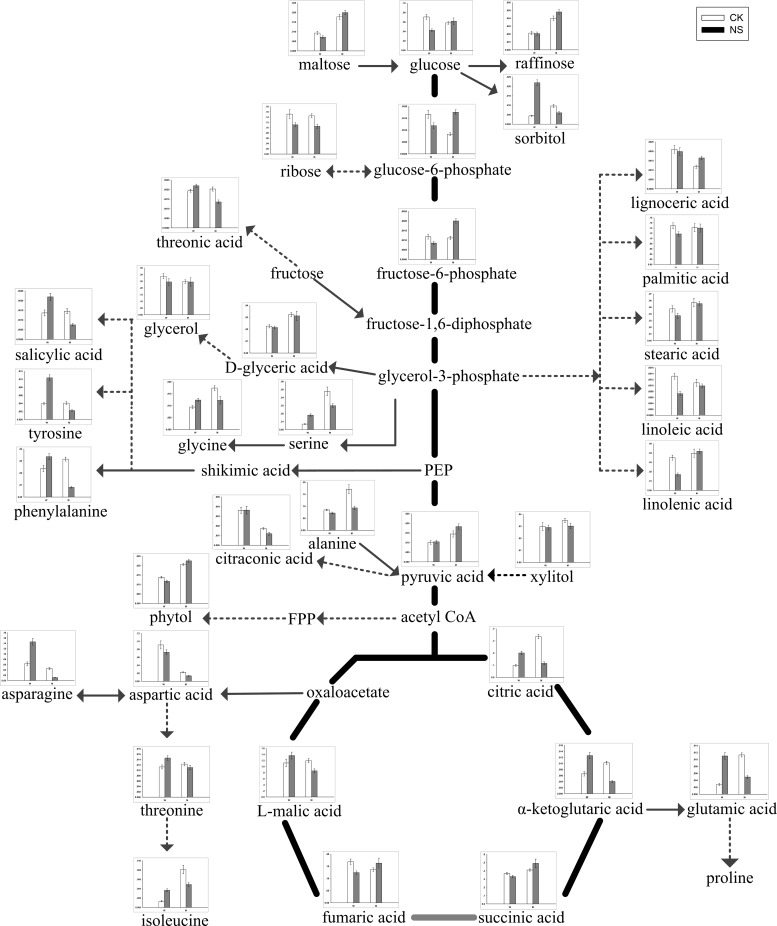
Fig 4. Changes in metabolites of the metabolic pathways in the leaves of the two soybean genotypes seedlings varied with salt tolerance 14 days after the imposition of neutral-salt stress.
W and M on the X-axis indicate wild soybean and cultivated soybean, respectively. The values on the Y-axis indicate the relative concentration of metabolites. CK: control treatment, NS: neutral-salt stress.

