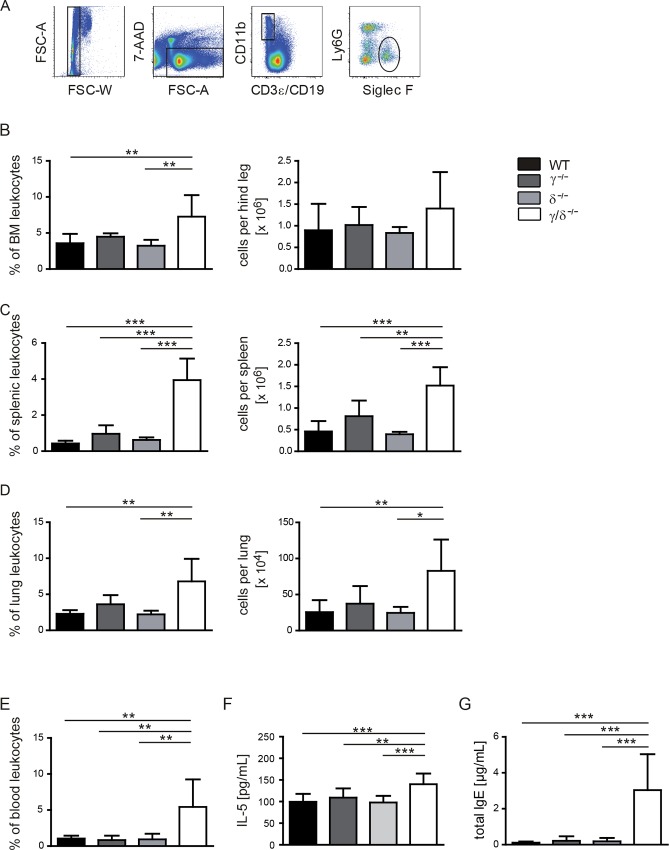
Fig 1. Numbers of eosinophils and serum concentrations of IL-5 and IgE are elevated in p110γ/δ-/- mice.
(A—E) Eosinophil numbers in p110γ-/-, p110δ-/-, and p110γ/δ-/- and WT mice (n = 5–8). To determine eosinophil numbers, leukocyte suspensions from BM, spleen, lung, and blood were analysed by flow cytometry. (A) Eosinophils were gated as CD3ε- CD19- CD11b+ Ly6G- Siglec F+ singlet leukocytes. Lung eosinophils were stained and gated as shown in S2 Fig. Percentages of living cells (FSC/SSC gate) and total cell counts of eosinophils (B) in the BM, (C) in the spleen, (D) in the lung, and (E) in the blood are depicted. Serum concentrations of (F) IL-5 and (G) IgE in p110γ-/-, p110δ-/-, p110γ/δ-/- and WT mice (n = 10). Bars represent means + SD. Data were analysed by One-way ANOVA followed by Bonferroni’s comparison tests for selected pairs of columns. ***P < 0.001, **P < 0.01, *P < 0.05. Asterisks indicate differences in comparison to p110γ/δ-/- mice.

