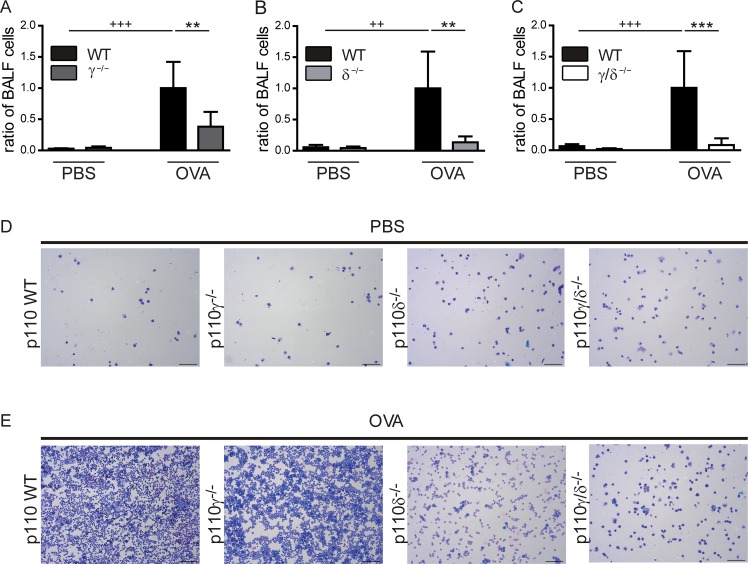
Fig 2. Bronchoalveolar cell infiltration is reduced in OVA-treated p110γ-/-, p110δ-/-, and p110γ/δ-/- mice.
To determine OVA-induced bronchoalveolar cell infiltration, cells were collected by BAL and counted with a Neubauer counting chamber. For better comparison between the knock-out groups, cell counts were normalized to the corresponding OVA WT group. To this end, ratios of BALF cells were calculated as individual cell count / mean cell count of the corresponding OVA WT group. (A—C) BALF cells from OVA-treated and PBS-treated KO and corresponding WT mice. (A) BALF cells from p110γ-/- and WT mice (n = 3–6). (B) BALF cells from p110δ-/- and WT mice (n = 4–5). (C) BALF cells from p110γ/δ-/- and WT mice (n = 5–6). Bars express means + SD. Data were analysed by One-way ANOVA followed by Bonferroni’s comparison tests for selected pairs of columns. +++ P < 0.001, ++ P < 0.01, + P < 0.05. + indicate differences between WT PBS and WT OVA groups. ***P < 0.001, **P < 0.01, *P < 0.05. Asterisks indicate differences between OVA-treated groups. Representative cellspins of BALF samples after (D) PBS and (E) OVA-treatment. 1/5 of total BAL cells were used for each cell spin. Magnification 100x, scale = 100 μM.

