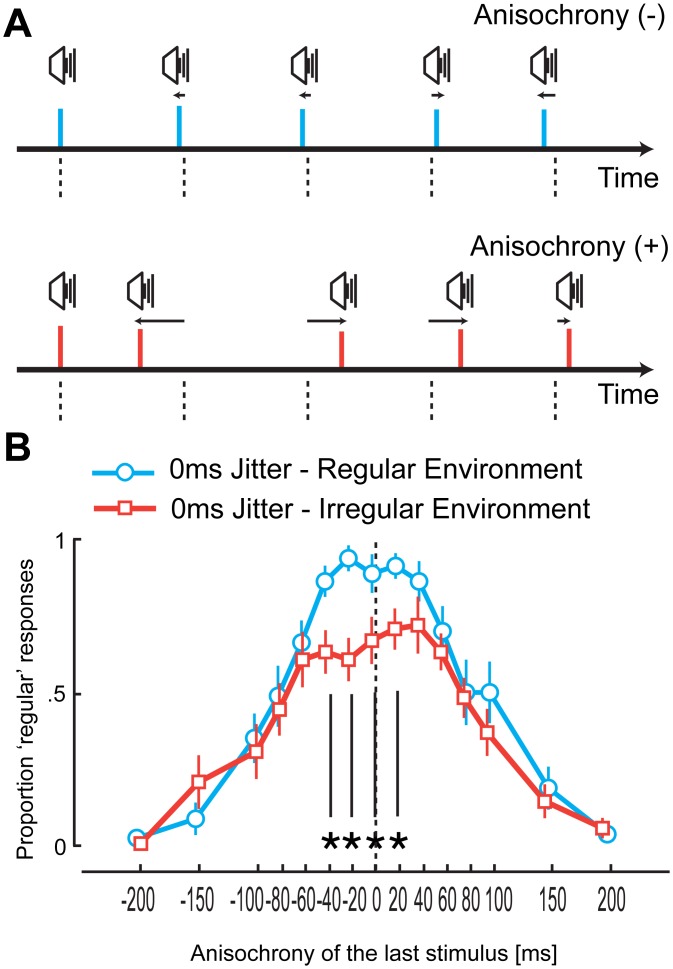
Fig 1. Experimental stimuli, design, and results of Experiment 1.
(A) Top: Example of a sequence in a perceptually regular environment with the final stimulus earlier than expected. Bottom: Example of a sequence in a perceptually irregular environment with the final stimulus later than expected. (B) Proportion of ‘regular’ responses as a function of the timing of the final auditory stimulus in the sequence. Each line represents data obtained with 0 ms jitter level for the two groups. When comparing the data obtained from the identical 0 ms jitter level sequences presented in both groups, the number of ‘regular’ responses is significantly lower for the perceptually irregular group at the points denoted by an asterisk (S2 Table). In all graphs, the error bars represent the standard error of the mean.

