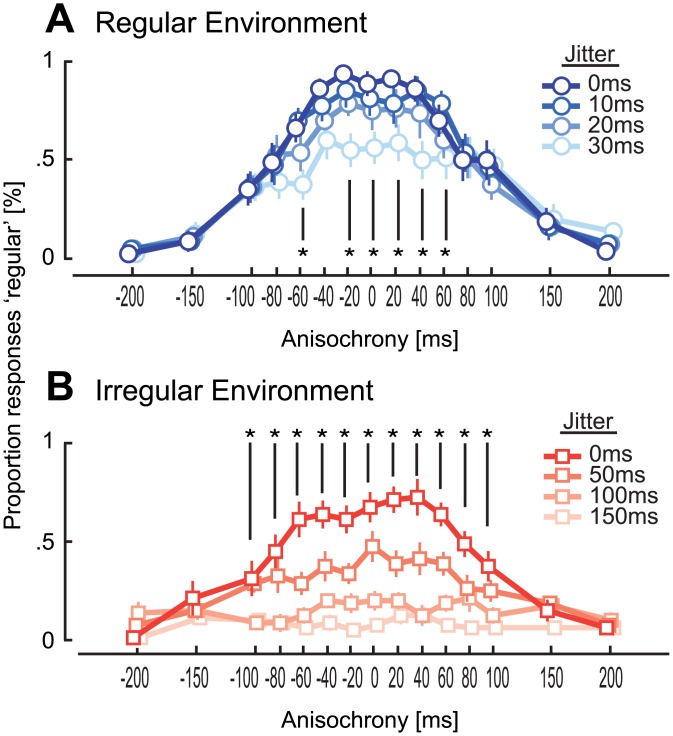
Fig 2. Additional analysis of Experiment 1.
Proportion of ‘regular’ responses as a function of the timing of the final stimulus in the sequence (A) for the perceptually regular environment group and (B) for the perceptually irregular environment group. Each line represents one of the four jitter levels. The distribution of responses becomes steeper at lower jitter levels for each group. Asterisks denote anisochronies at which the proportion of responses differs significantly across jitters levels within a group (see S1 Table for statistical tests).

