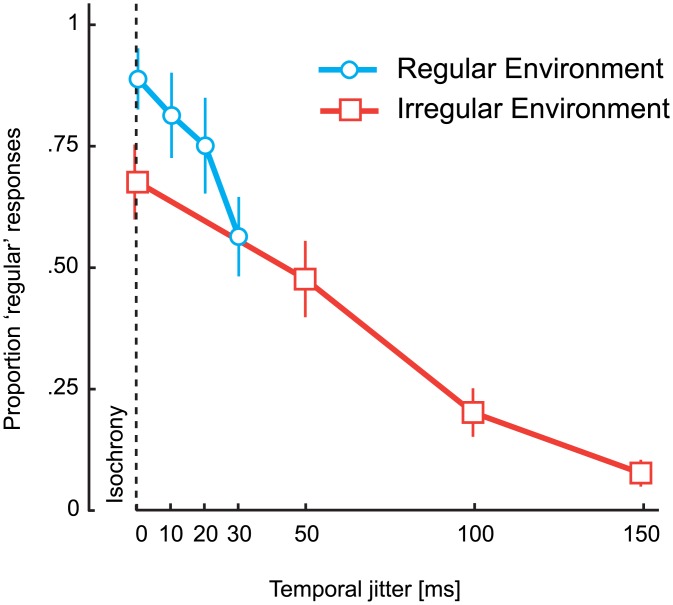
Fig 3. Proportion of regular responses as a function of the jitter level for 0 ms anisochrony of the final stimulus.
Participants respond more frequently ‘regular’ when the final stimulus follows a sequence of perfectly regularly timed stimuli in the regular environment (blue line) in comparison to an irregular environment (red line).

