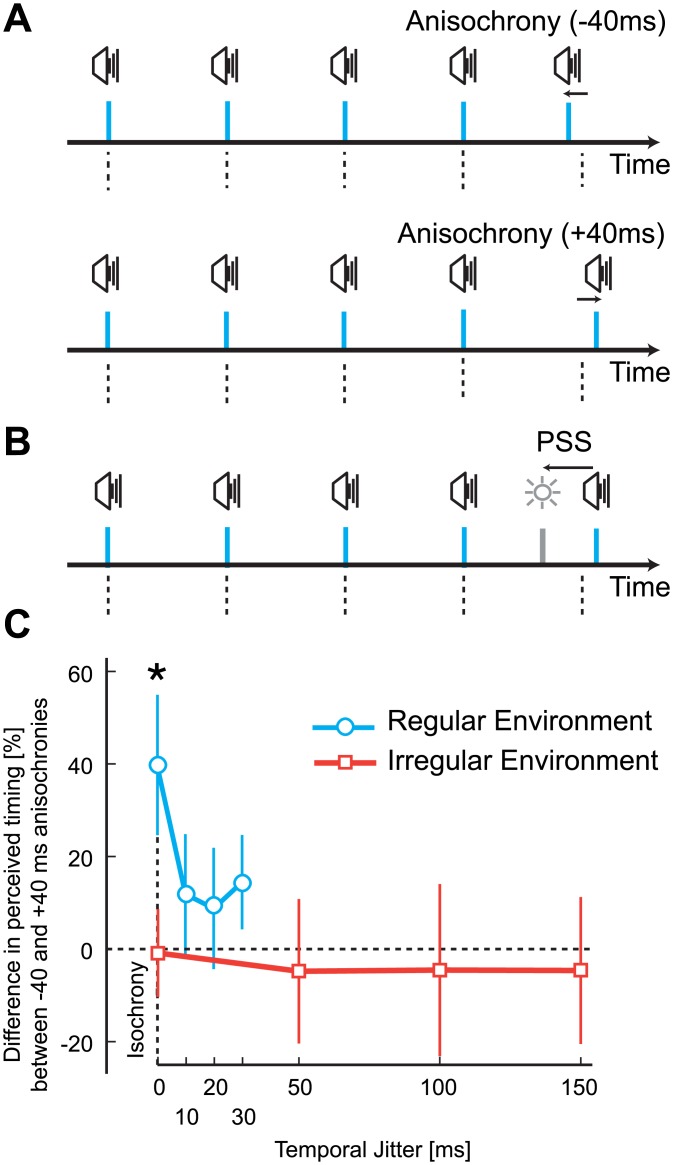
Fig 4. Experimental stimuli, design, and results of Experiment 2.
(A) Examples of trial sequences in regular environments when the final stimulus was earlier (top panel) or later (bottom panel) than expected. Participants judged the temporal order of the final auditory stimulus and a visual probe (B), which was used to determine the point of subjective simultaneity (PSS). (C) Difference in perceived timing (as a percentage) between stimuli presented -40 ms earlier than expected and +40 ms later than expected as a function of the jitter level. Each line represents the two environment groups.

