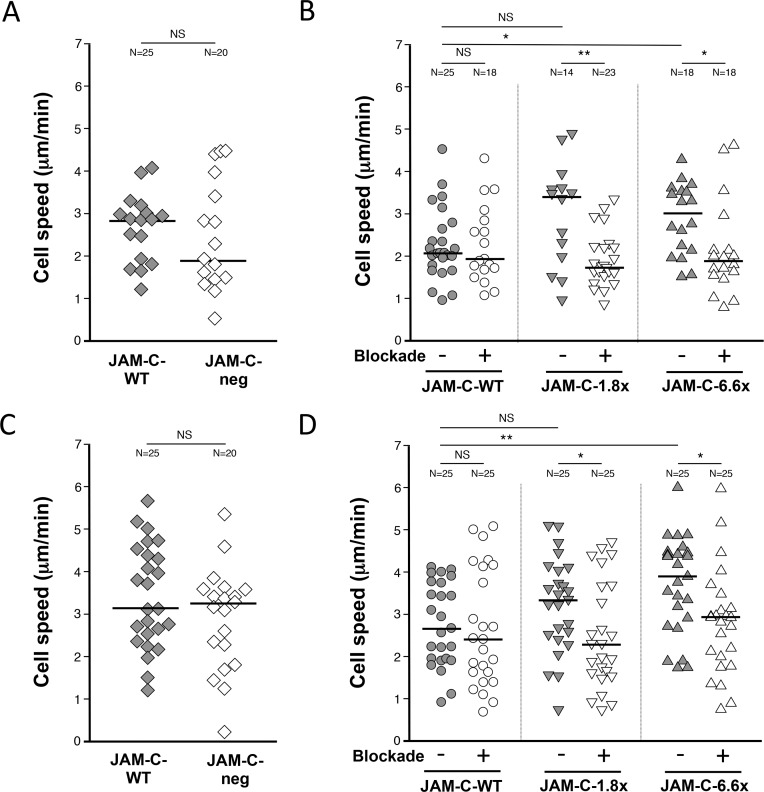
Fig 5. Monocytes migrate at higher velocities on HUVECs expressing increasing levels of JAM-C.
The velocity of individual migrating monocytes was measured in the (A, B) abluminal and (C, D) abluminal compartment of HUVEC co-cultures under flow. (A, C) No significant effect was seen with monocytes on HUVECs with JAM-C-neg (white diamonds) compared to the sham transfected control JAM-C-WT HUVECs (grey diamonds) in both the (A) luminal and (C) abluminal compartment. Monocyte velocity was measured on JAM-C-WT (grey circles) JAM-C-1.8x (grey inverted triangles) and JAM-C-6.6x (grey triangles) HUVECs in the (B) luminal and (D) abluminal compartment. Blockade of JAM-C function using the 225.3 and isotype control were marked as ‘+’ and ‘-’ respectively. ‘N’ numbers indicate the number of monocytes analyzed per group. JAM-C-1.8x and JAM-C-6.6x had 1.8- and 6.6-times more expression than wild type levels (JAM-C-WT) respectively. Median values are marked. Mann–Whitney test was used for all dot plots statistical analyses (NS = not significant). Data shown is representative of two independent experiments (N = 2).

