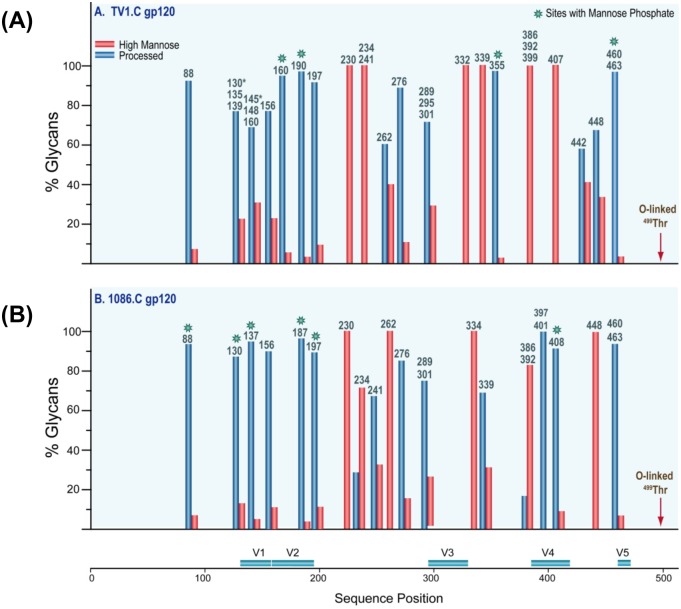
Fig 2. Characterization of potential N-linked glycosylation sites (PNGS).
The glycan compositions (in percentages) of TV1.C (A) and 1086.C (B) glycopeptides were sorted and broadly grouped based on criteria described previously [34]. Here, the glycan profile of each glycopeptide with either single or multiple glycosylation sites were represented by a pair of bars denoting the percentage of the type of glycan: high mannose (red) or processed (blue), according to Env sequence position, as indicated in S2 Table (TV1.C gp120) and 3 (1086.C gp120). (See also S2 and S3 Tables for more detailed information on the absolute occupancies at each site). The asterisks denote sites containing mannose phosphate.

