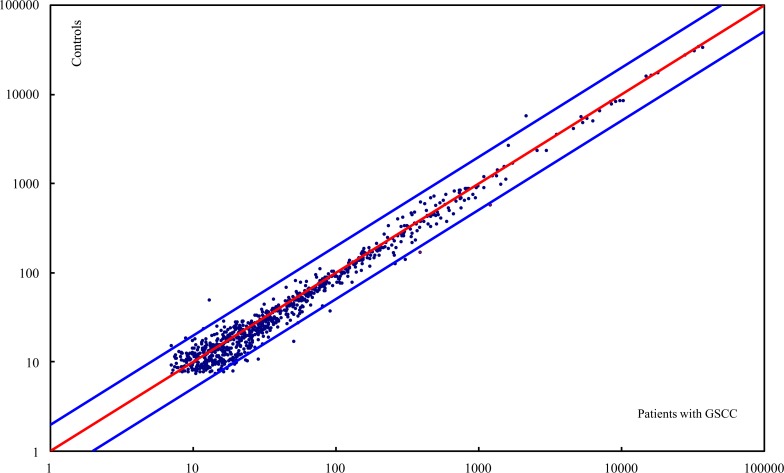
Fig 1. Plasma miRNA profile in patients with GSCC.
The scatter plot compares the relative levels of expression of genome-wide miRNAs in plasma from patients with GSCC and healthy controls. Each point represents an individual miRNA. The red line represents a fold change of 1, and the blue lines indicate a 2-fold change in the level of miRNA expression in patients with GSCC (Top line: 2-fold down; Bottom line: 2-fold up).

