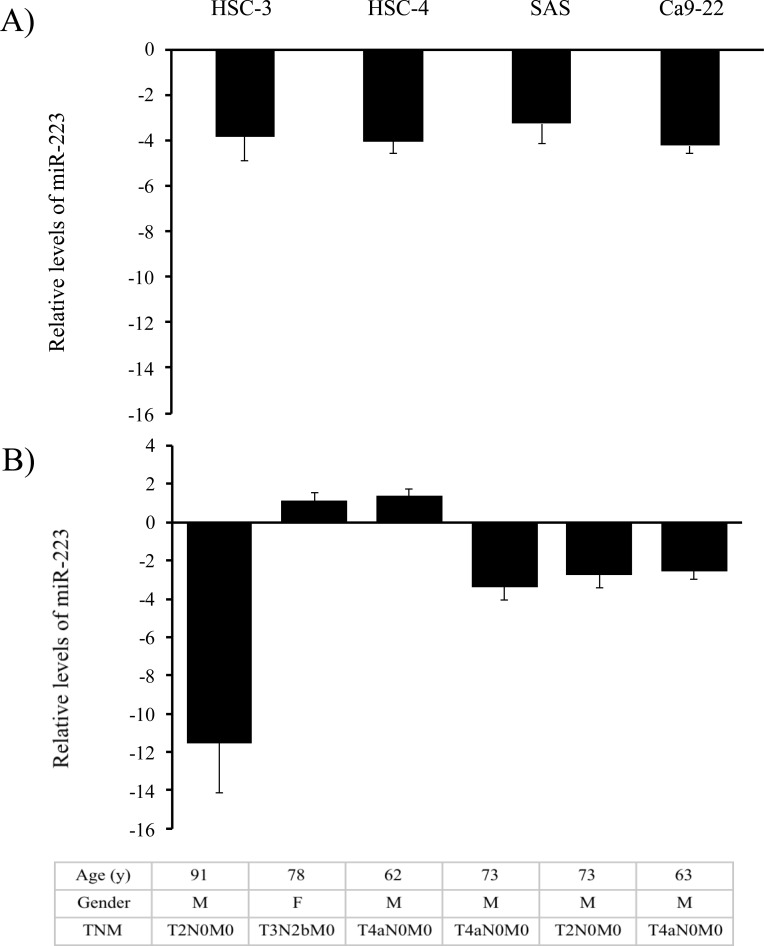
Fig 3. Relative levels of miR-223 expression in OSCC cell lines and tissues.
(A) OSCC cell lines: Relative levels of miR-223 expression were evaluated using the equation–log10 1/2-⊿⊿Ct in which ΔΔCt = ΔCtcell line―ΔCtnormal.tissue. The ΔCt value of miR-223 in each sample was calculated by normalization with endogenous control RNU6B (ΔCt = CtmiRNA- CtU6RNA). (B) OSCC tissues: The upper panel shows the relative levels of miR-223 expression that were evaluated using the equation 2―ΔΔCt when 2―ΔΔCt ≥1 or -1/2⊿⊿Ct when 2―ΔΔCt < 1 in which ΔΔCt = ΔCtOSCC tissue―ΔCtnormal tissue, and ΔCt = CtmiRNA- CtU6RNA. The lower panel shows the characteristics of patients from whom cancerous and adjacent non-cancerous tissues were tested. TNM: tumor node metastasis staging system.

