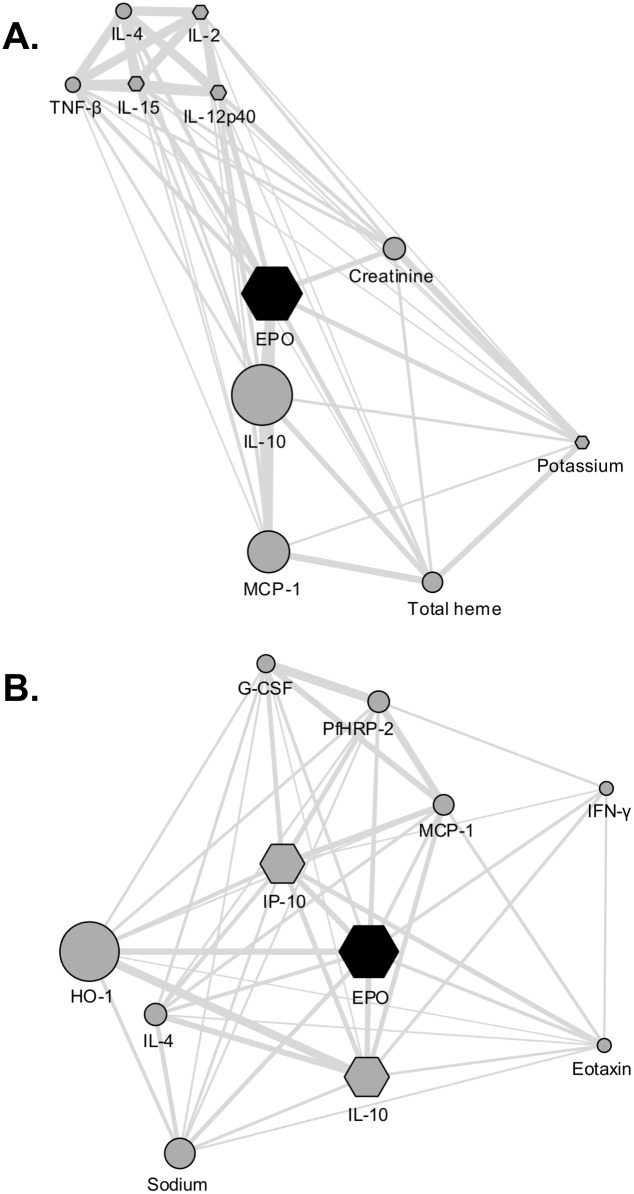
Fig 2. Sub-networks showing the ten parameters most related to plasma level of EPO during malaria.
Sub-networks obtained for (A) the NCM group and the (B) CM group. Nodes with the highest number of connections with other parameters are represented by hexagons. For each parameter, the size of the node is associated with its level of correlation with EPO levels. Interactions between parameters are represented by edges (lines), thicker lines representing a higher confidence level for a given interaction.

