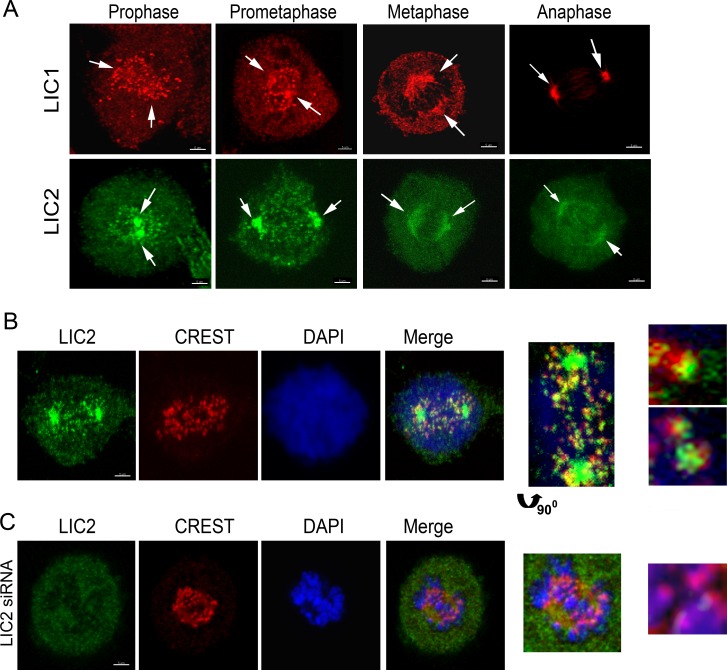
Fig 1. Localization of LICs in Mitosis.
A) Confocal immunofluorescence images of Hela cells depicting the localization of LIC1 (red) and LIC2 (green), shown by arrows. B) Fluorescence images of Hela cells showing the presence of LIC2 (green, using the ThermoScientific antibody) at kinetochores (CREST, red) in prometaphase. C) Fluorescence imaging after treatment of cells with anti-LIC2 siRNA, showing loss of LIC2 signal from spindle poles and kinetochores (arrow in inset). DAPI was used to visualize chromosomes. Scalebar is 5 μm in all images that are not zoomed.

