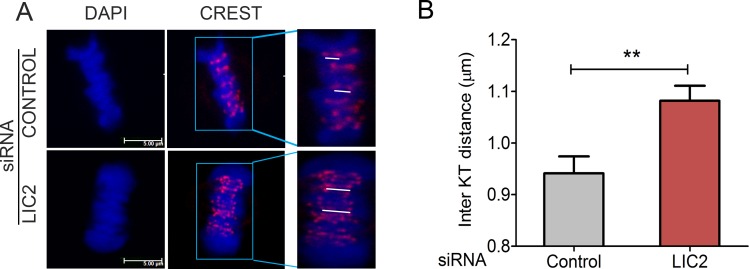
Fig 5. LIC2 depletion leads to increased inter-kinetochore tension in metaphase.
A) Confocal immunofluorescence images of metaphase Hela cells stained for kinetochores (red, CREST) and chromatin (DAPI). White lines indicate representative distance measurements between sister kinetochores. The insets on the right are zoomed to equivalent levels in both upper and lower panels. B) Average inter-kinetochore distance (μm) on y-axis. 3 experiments; n = at least 30 metaphase cells per experiment (10 pairs of sister chromatids measured per cell). ** = p < 0.01). Scalebar is 5 μm in all images that are not zoomed.

