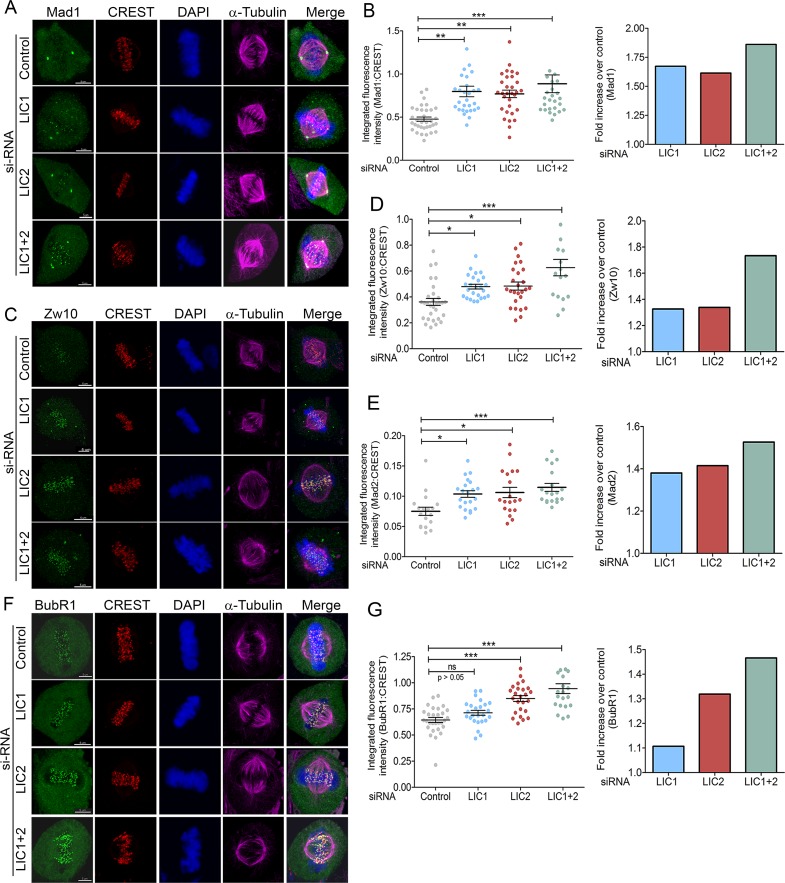
Fig 6. LIC2 removes key SAC proteins from metaphase kinetochores to inactivate the spindle assembly checkpoint.
Representative images showing accumulation of SAC proteins A) Mad1, C) Zw10 and F) BubR1 at metaphase kinetochores upon prolonged metaphase arrest following indicated siRNA treatments. B, D, E, G) Left panels: integrated fluorescence intensities of SAC proteins normalized to the respective kinetochore (CREST) intensities for B) Mad1, D) Zw10, E) Mad2 and G) BubR1 at metaphase kinetochores. Y-axis = mean fluorescence intensity (+/- SEM) from 3 independent experiments, n = at least 18 metaphase cells per experiment for LIC1 and LIC2 depletion. Right panels: fold increase in normalized fluorescence intensity over control (GFP siRNA) for the various SAC proteins. Scalebar is 5 μm in all images.

