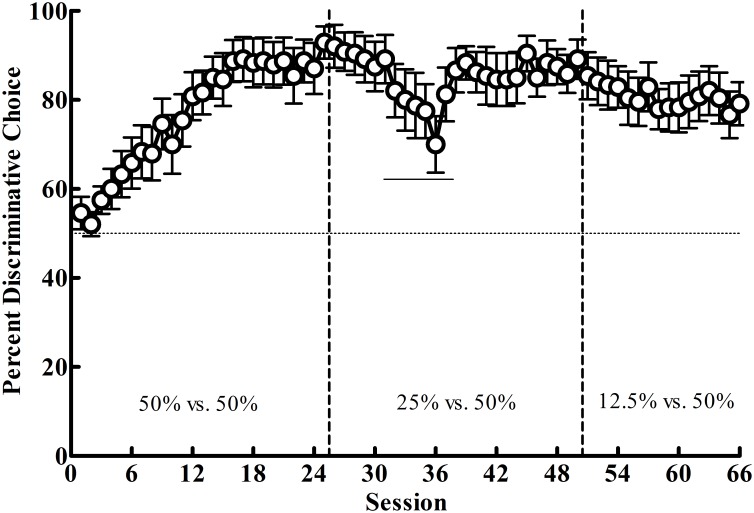
Fig 4. Experiment 1: Mean percentage choice (± SEM) of the Discriminative alternative as a function of session for Phases 1–3.
Vertical lines indicate phase changes, the horizontal line indicates indifference between the two altrnatives (50%), and the solid horizontal line indicates sessions where the left response key intermittently malfunctioned.

