Figure 2.
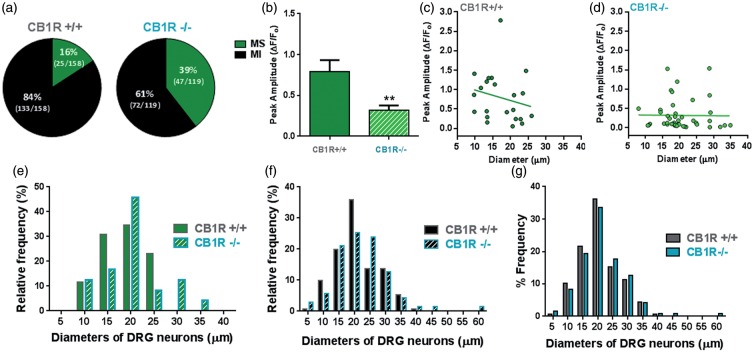
Increased percentage of menthol sensitive neurons in CB1R−/− DRG cultures. Primary cultures were generated from lumbar DRG isolated from CB1R+/+ (N = 4 mice, 11 coverslips) and CB1R−/− (N = 5 mice, 10 coverslips), loaded with FURA-2 and stimulated with the TRPM8 agonist menthol. (a) Pie-graphs depicting the percentage of menthol sensitive (MS) and menthol-insensitive (MI) neurons per genotype with the number of neurons imaged placed in parentheses; CB1R−/− had a significantly higher percentage of menthol sensitive neurons, p < 0.0001, Fisher’s exact test. (b) Average amplitude of peak menthol responses in CB1R+/+ and CB1R−/− cultures. Data are presented as mean amplitude of the ΔF/Fo ± SEM. ** p < 0.05, Student’s t-test. Scatter plot of neuronal diameters versus peak menthol response; each point represents a single neuron from (c) CB1R+/+ and (d) CB1R−/− cultures. Relative frequency of (e) ‘MS’ and (f) ‘MI’ DRG neurons in CB1R+/+ and CB1R−/− according to neuron diameter (in µm). (e) Frequency distribution (in percentage) of all DRG neurons in culture per diameter and per genotype; bin centers set at 5 µm.

