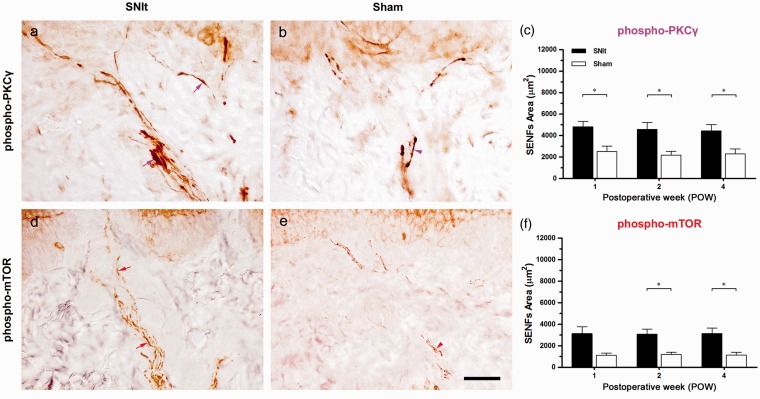
Figure 5.
Increases of PKCγ and mTOR expression in intact SENFs following SNIt. At POW1 after (a, d) SNIt and (b, e) Sham, the footpad sections were immunostained with antisera against (a, b) phospho-PKCγ and (d, e) phospho-mTOR. Dermal distributions between SNIt and Sham were quantified by the temporal changes of the morphological patterns in (c) phospho-PKCγ and (f) phospho-mTOR, which were represented as SENFs Area (mean ± SD; n = 5 at each POW after SNIt and Sham). Student’s t test was applied to examine the differences against the results of Sham at each time point. Two-way repeated measures ANOVA was also performed following the Bonferroni’s post hoc test. Scale bar = 50 µm.

