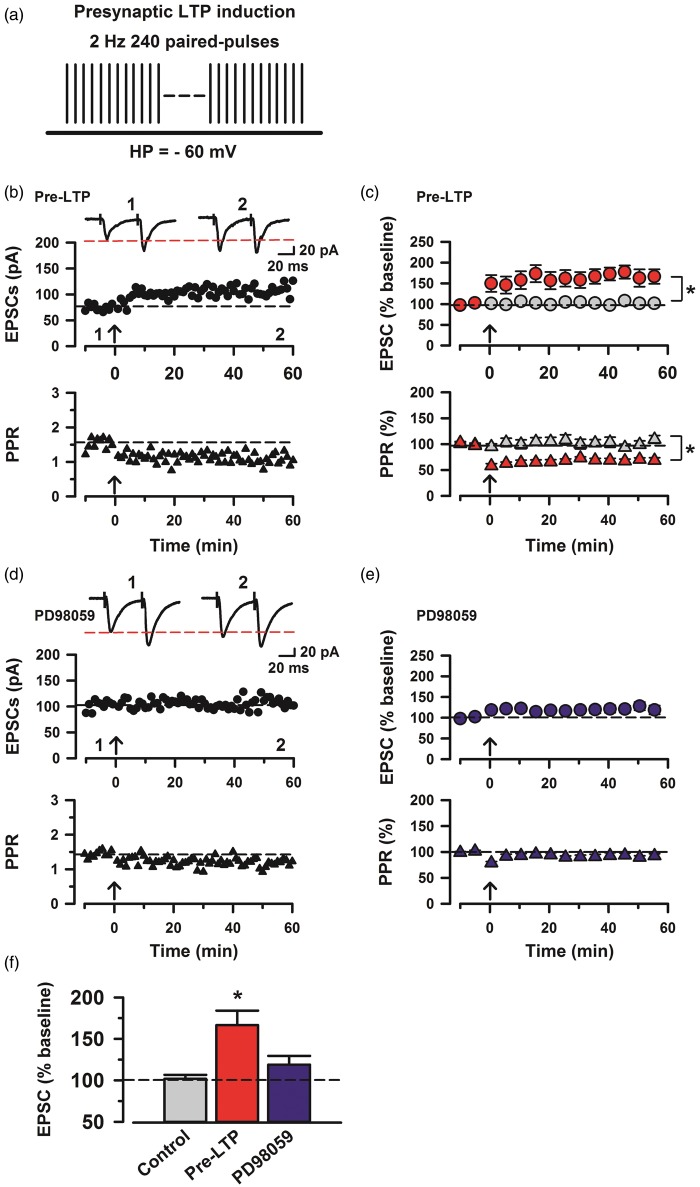
Figure 1.
Induction of cingulate pre-LTP requires MAP kinase activity. (a) A scheme illustrating the pre-LTP induction protocol consisting of low-frequency paired-pulse stimulation (2 Hz for 2 min) at a holding potential of −60 mV. (b) Top: sample traces of eEPSCs with paired-pulse stimulation at 50 ms interstimulus interval during baseline (1) and 60 min after the pre-LTP (2) at a holding membrane potential of −60 mV. Middle: a time course plot of a representative single example. Bottom: time course plot of PPR for this neuron. The arrow donates the time of pre-LTP induction. (c) Pooled data to illustrate the time course of pre-LTP and changes in PPR. Top: pre-LTP (red, n = 7 neurons/5 mice) and control (grey, n = 6/4). Bottom: PPR for these neurons. *p < 0.05 for PPR change estimated for the 10 min intervals baseline and between 50 min and 60 min after the induction stimulation. (d) Top: a time course plot of a representative single example with application of ERK inhibitor, PD98059 (100 µM). Bottom: time course plot of PPR for this neuron. (e) PD98059 (blue, n = 10/6) in the bath solution blocks pre-LTP induction. (f) Summary of the effects of an ERK inhibitor, PD98059 on pre-LTP. There was statistical difference when comparing control with pre-LTP, PD98059 groups (one-way ANOVA, F2,43 = 12.03, *p < 0.05). The mean amplitudes of eEPSCs were determined at 50–60 min after the pre-LTP induction stimulation. Error bars represent SEM.

