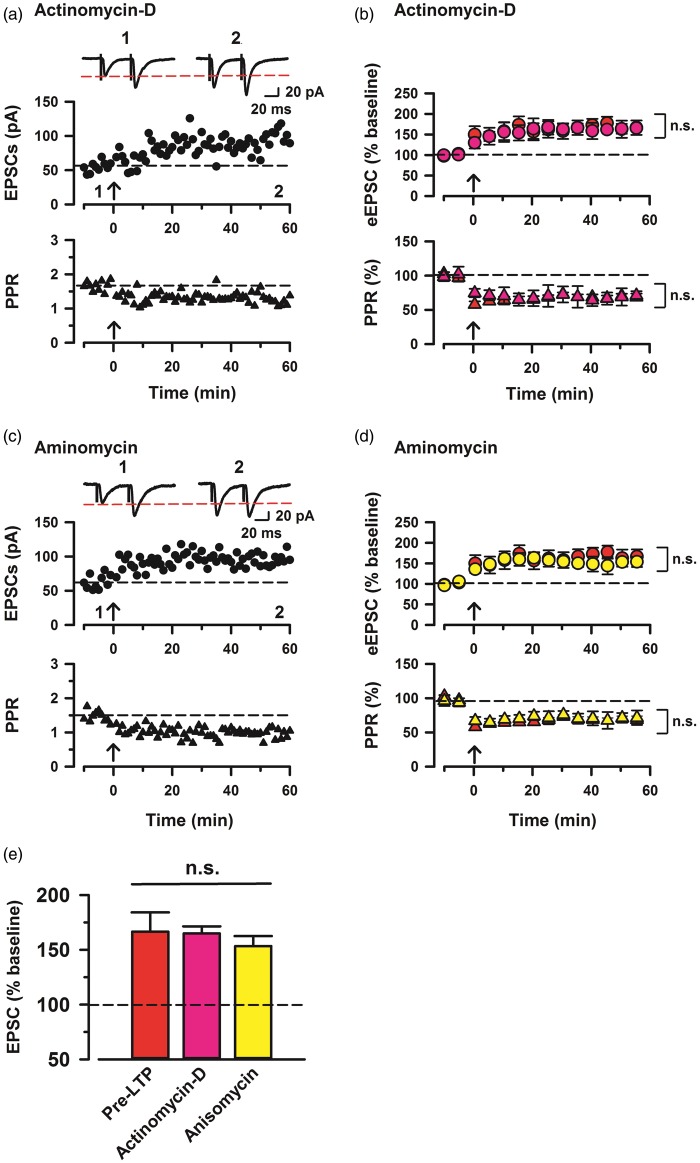
Figure 4.
Enhanced presynaptic potentiation in the ACC neurons mediated by transcription and translation activities. (a) Top: a time course plot of a representative single example with application of a transcription inhibitor, actinomycin-D (40 µM). Bottom: a time course plot of PPR for this neuron. (b) Pooled data to illustrate the time course of pre-LTP and changes in PPR with application of actinomycin. Top: actinomycin-D (pink, n = 11 neurons/7 mice) and pre-LTP (red, n = 7/5). Bottom: PPR for these neurons. (c) Top: a time course plot of a representative single example with application of a translation inhibitor, anisomycin (20 µM). Bottom: a time course plot of PPR for this neuron. (d) Pooled data to illustrate the time course of pre-LTP and changes in PPR with application of anisomycin. Top: anisomycin (yellow, n = 9/6) and pre-LTP. Bottom: PPR for these neurons. (e) Summary of the effects of pre-LTP, actinomycin-D, and anisomycin after pre-LTP induction stimulation. The amplitudes of eEPSCs were not significantly different between pre-LTP, actinomycin-D, and anisomycin (one-way ANOVA, F2,51 = 0.548, p > 0.05, NS). The mean amplitudes of eEPSCs were determined at 50–60 min after the pre-LTP induction stimulation. Error bars represent SEM.

