Figure 5.
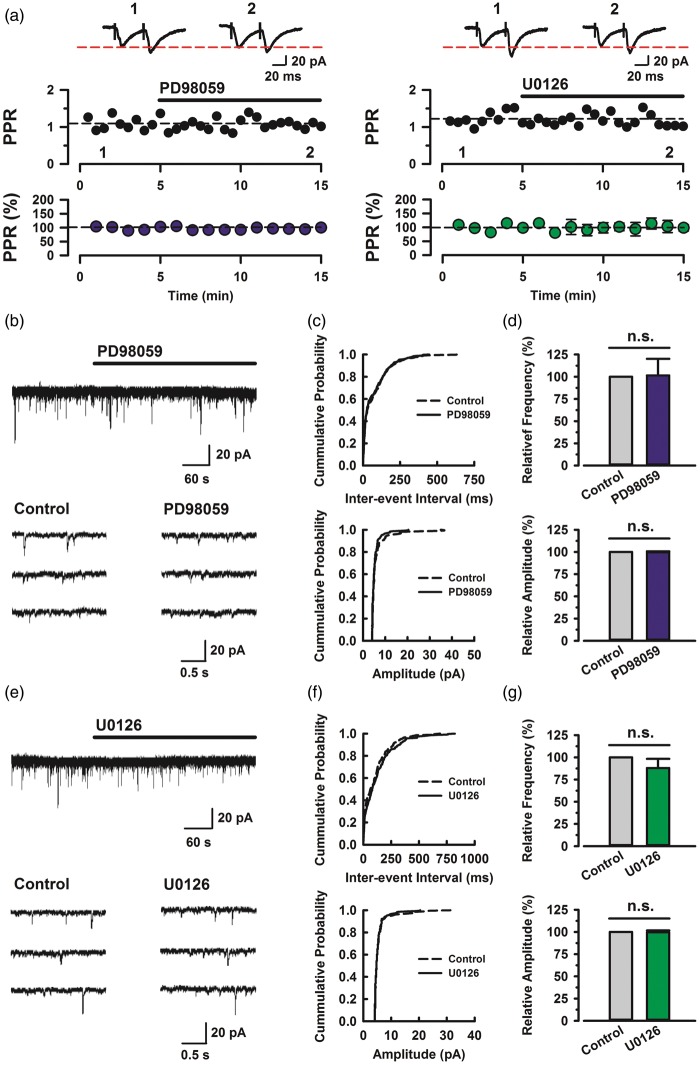
Effects of MAP kinases on baseline PPF and spontaneous EPSCs. (a) Map kinase did not affect the baseline PPF. Top: sample traces of eEPSCs with paired-pulse stimulation at 50 ms interstimulus interval during baseline (1) and 10 min after the application of PD98059 (left, 100 µM) and U0126 (left, 100 µM) (2) at a holding membrane potential of −60 mV. Middle: a time course plot of PPR for a single example neuron. Bottom: pooled data to illustrate the time course of changes in PPR with application of PD98059 (left, n = 5/3) and U0126 (right, n = 5/3). (b) Top: continuous chart recording of spontaneous EPSCs before and during the action of PD98059 (100 µM). Three consecutive traces of EPSCs are shown in an expanded scale in time, before (bottom left) and under the action of PD98059 (bottom right). (c) Cummulative distribution of the inter-event interval (left) and amplitude (right) of EPSCs in control (dotted line) and during (continuous line) the action of PD98059 (same neuron as in Figure 4(b)). (d) Summary of EPSC frequency (left) and amplitude (right) under the action of PD98059 (n = 6/4) relative to control. Both the frequency and amplitude of EPSC were not significantly different between control and PD98059 (*p > 0.05, NS). (e) Top: continuous chart recording of spontaneous EPSCs before and during the action of U0126 (100 µM). Three consecutive traces of EPSCs are shown in an expanded scale in time, before (bottom left) and under the action of U0126 (bottom right). (f) Cummulative distribution of the inter-event interval (left) and amplitude (right) of EPSCs in control (dotted line) and during (continuous line) the action of U0126 (same neuron as in Figure 4(e)). (g) Summary of EPSC frequency (left) and amplitude (right) under the action of U0126 (n = 6/3) relative to control. Both The frequency and amplitude of EPSC were not significantly different between control and U0126 (*p > 0.05, NS). Error bars represent SEM.

